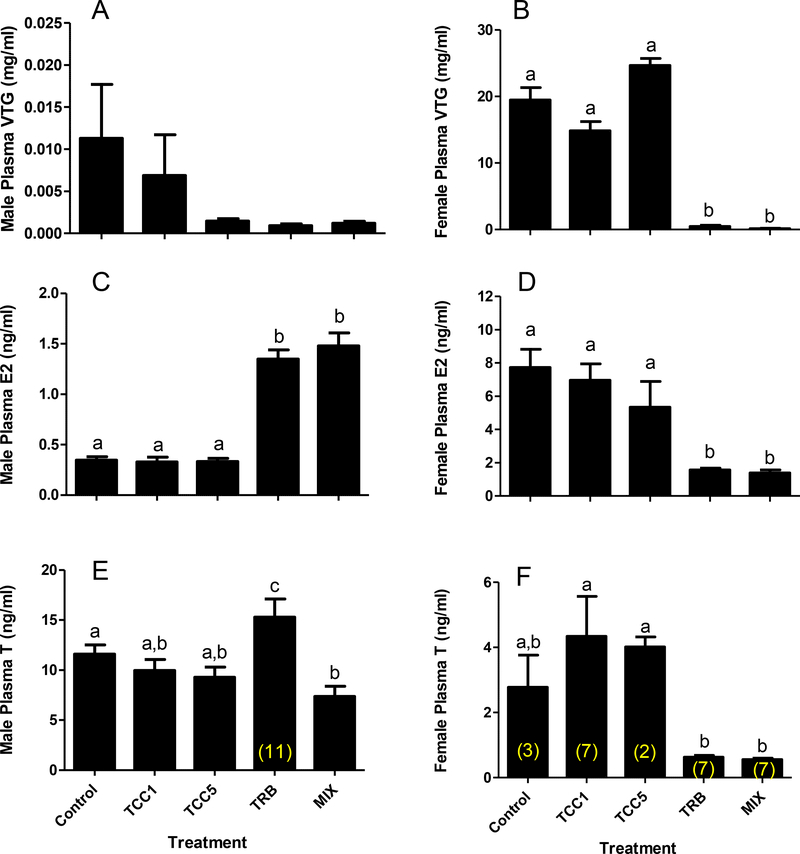
Figure 3.
Fathead minnow (A) male plasma vitellogenin (VTG), (B) female plasma VTG, (C) male plasma 17β-estradiol (E2), (D) female plasma E2, (E) male plasma testosterone (T), (F) female plasma T following 22 d of continuous exposure to 1 (TCC1) or 5 (TCC5) μg triclocarban/L, 0.5 μg 17β-trenbolone/L (TRB), or a mixture (MIX) of 5 μg TCC and 0.5 μg TRB/L. Bars on graph represent mean (± SE; n=12 except where indicated in parentheses on respective columns). Letters indicate statistically significant differences between treatments (p ≤ 0.05).

