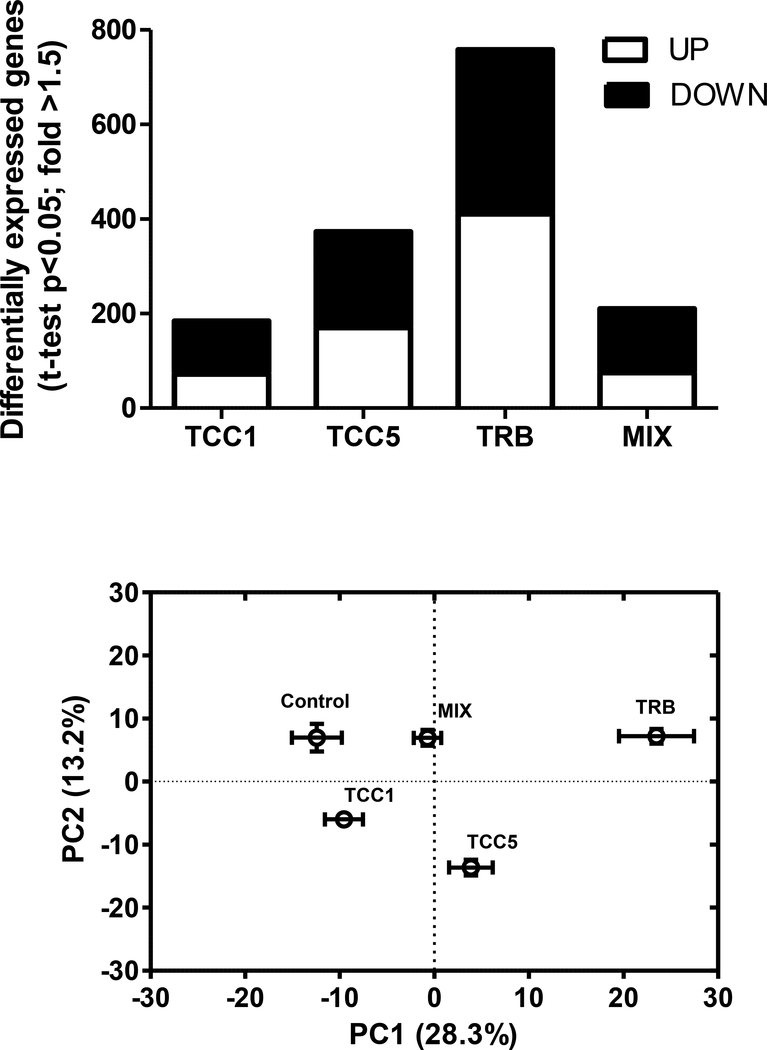
Figure 5.
(A) Number of putative differentially expressed genes in fathead minnow ovary tissue, relative to controls, following 22 d of continuous exposure to 1 (TCC1) or 5 (TCC5) μg triclocarban/L, 0.5 μg 17β-trenbolone/L (TRB), or a mixture (MIX) of 5 μg triclocarban and 0.5 μg TRB/L. Significance based on pair-wise t-test, p<0.05, with no multiple testing correction. White portion of bar indicates genes whose expression was up-regulated relative to controls. Black portion of the bar indicates genes whose expression was down-regulated relative to controls. (B) Principal component analysis (PCA) scores plots. (A) PCA conducted on the group of 759 genes identified as differentially expressed among all five treatments examined in the study (one-way ANOVA, uncorrected p<0.05; Supplementary Table S.8). Error bars represent SEM for principal components (PCs) 1 and 2, respectively (n=5 for all treatments except TRB, n=4).

