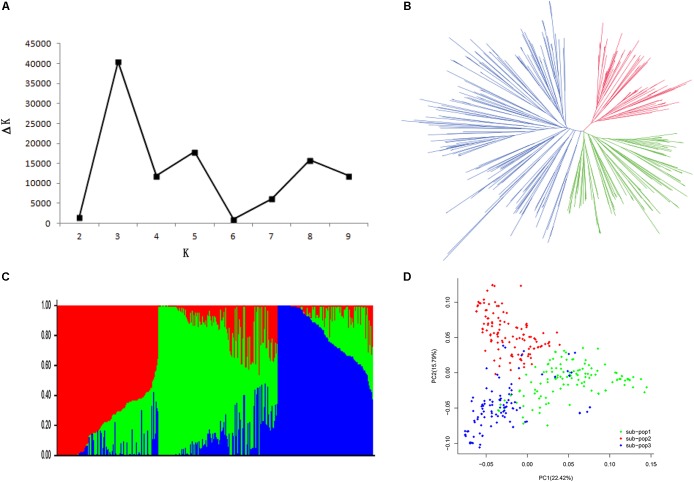
FIGURE 2.
Population structure of 368 soybean accessions. (A) Calculation of the true K of the SBL population according to Evanno et al. (2005). (B) A neighbor-joining tree of the tested accessions that could be divided into three subpopulations. (C) Population structure was estimated by ADMIXTURE. Three colors represent three subpopulations, respectively. Each vertical column represents one individual and each colored segment in each column represents the percentage of the individual in the population. (D) PCA plot of the 368 accessions; two-dimensional scales were used to reveal population stratification.

