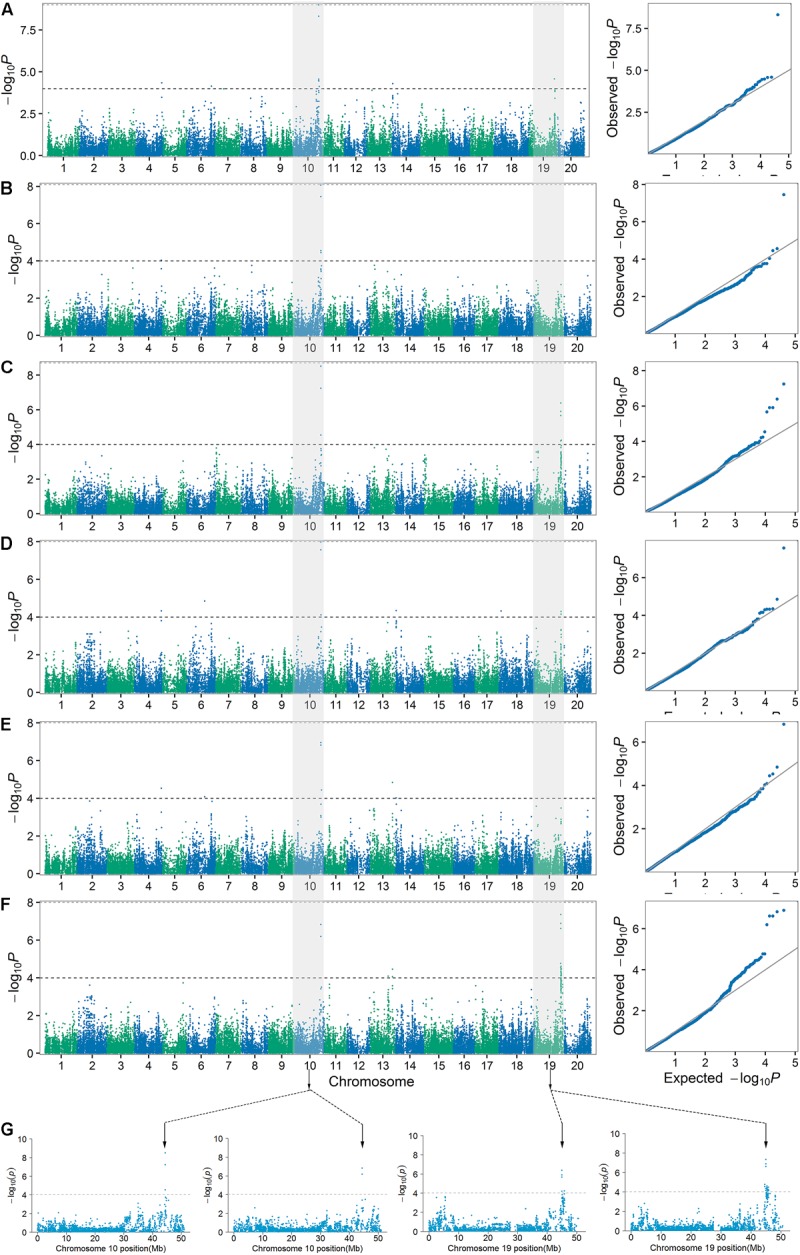
FIGURE 4.

Manhattan plots and quantile–quantile plots for PH1 (A), PH2 (B), PH3 (C), NN1 (D), NN2 (E), and NN3 (F) over three stages in the SBL population. The major loci for PH3 (left) and NN3 (right) in their Manhattan plots were located on chromosomes 10 and 19, respectively (G).
