
Figure 5. Differences in serum cytokine and chemokine levels between acute and convalescent phases of CHIKV infection.
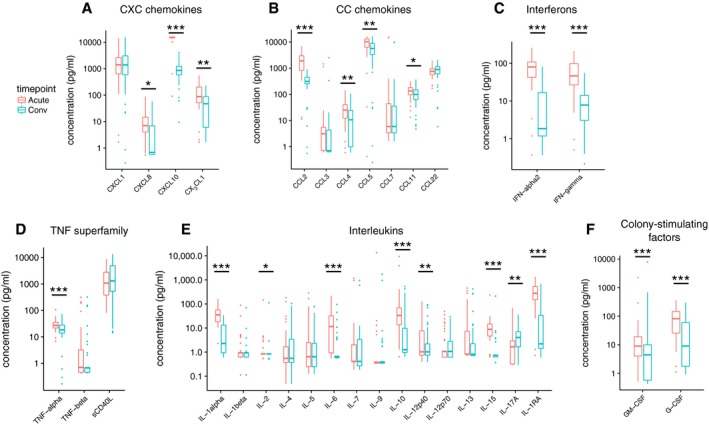
- CXC chemokines.
- CC chemokines.
- Interferons.
- TNF superfamily cytokines.
- Interleukins.
- Colony‐stimulating factors.
Official websites use .gov
A
.gov website belongs to an official
government organization in the United States.
Secure .gov websites use HTTPS
A lock (
) or https:// means you've safely
connected to the .gov website. Share sensitive
information only on official, secure websites.