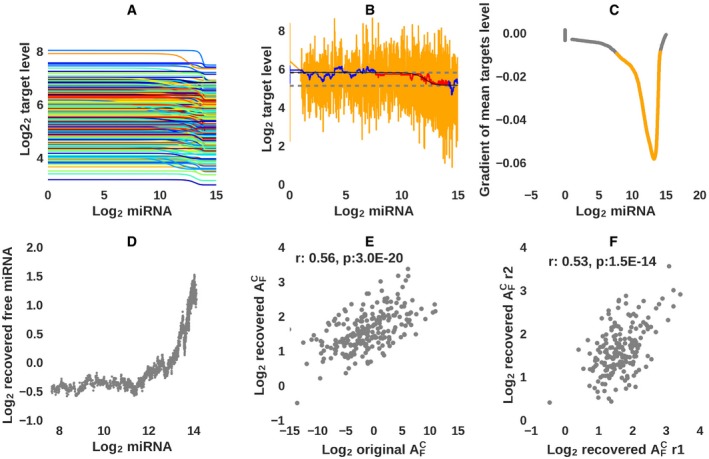
Figure 3. Validation of the approach for inferring target sensitivity from single‐cell data.

- Response of 300 in silico targets, each with associated parameters describing its transcription, decay, rates of binding to and dissociating from the miRNA (values drawn from distributions around experimentally measured values, see Appendix Fig S4) in response to increasing miRNA concentration.
- Noise (orange) was added to the target expression (black), and then, running means (blue) were calculated over increasingly wider windows to ensure that the estimated expression levels T ij for gene i in cell j (for cells used in the inference (red)) were between the maximum () and minimum () levels, corresponding to no miRNA being expressed and to the miRNA being expressed at very high levels in the cell (allowing for a small tolerance c; dashed lines).
- Cells for which the gradient of the total target level with respect to the miRNA level was less than −0.01 (shown in orange, and corresponding to the points shown in red in panel (B)) were used to construct the matrix of gene expression levels per cell.
- Scatter plot of the total miRNA levels that were used as input to the model and the levels of free miRNA inferred from the simulated data.
- Scatter plot of the input vs. inferred values. The Pearson correlation coefficient and its associated P‐value are also shown.
- Scatter plot of values inferred from in silico data that were generated with the same input target parameters, but to which two distinct sets of “measurement errors” were applied. The Pearson correlation and associated P‐value are also shown.
