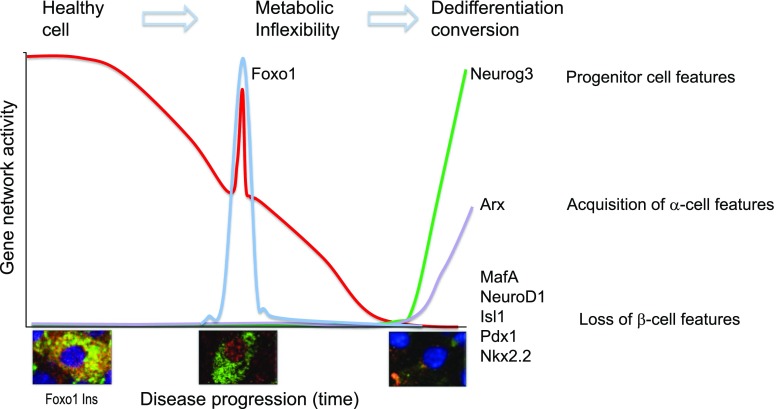
Figure 4.
Model of the progression of β-cell failure. The graph shows a model of changes in gene expression during three phases of progression of β-cell dysfunction, indicated at the top. Metabolic inflexibility is a state in which the pairing of ATP generation with insulin secretion is impaired. Dedifferentiation is a state in which features of mature β-cells are lost. Shown at the bottom is representative immunohistochemistry of Foxo1 translocation from the cytoplasm to the nucleus of the β-cell in response to changes in glucose, lipid, and cytokine levels. Foxo is detected by red fluorescence, insulin by green fluorescence. Nuclear translocation is associated with the activation of a stress response that aims to prevent loss of β-cell features through the genes indicated on the right-hand column. Nuclear Foxo1 is degraded if hyperglycemia is not reversed, paving the way for the activation of progenitor-like features and conversion into α-like–cells.

