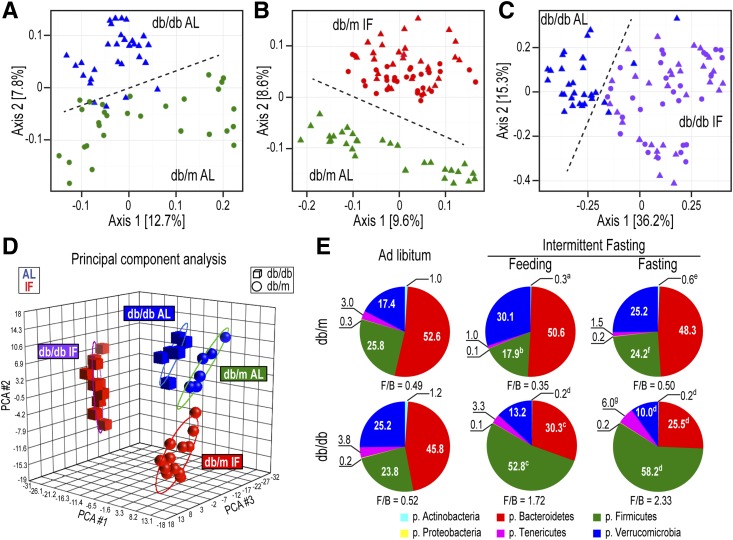
Figure 3.
IF resulted in distinct changes in the microbiota of db/db mice. A–C: β Diversity (presence/absence ordination): Dimensional reduction of the Jaccard distance on presence/absence OTU table, using the PCoA ordination method. A: db/m-AL (green circles) vs. db/db-AL (blue triangles) mice; samples separated along axis 2 according to sample type. B: db/m-AL (green triangles) vs. db/m-IF (feeding, red triangles; fasting, red circles) mice; samples separated along axis 2 according to type, which indicated that samples from IF and AL treatments have different incidences of OTUs. C: db/db-AL (blue triangles) vs. db/db-IF (feeding, purple triangles; fasting, purple circles) mice; samples separated along axis 1 according to type. Samples from db/db-AL mice had a smaller degree of variation in microbiome β diversity than db/db-IF samples. P = 0.001 in all comparisons; n = 5 mice/group. D: Principal component analysis (PCA) of microbiota. Relative abundance of bacteria present in at least 10% of the samples (n = 180) was used. Samples grouped by both disease (spheres, db/m; cubes, db/db) and treatment (blue, AL; red, IF) but less clearly by feeding/fasting within the IF groups. Note that the AL cohorts are closer to each other, whereas the IF cohorts were much further apart, suggesting bigger differences in the microbiomes of db/m-IF and db/db-IF mice. E: Relative proportions of the six most abundant phyla (the aggregate relative abundance for each of the phyla not represented here is less than 0.1). aP < 0.01 vs. db/m-AL; bP < 0.001 vs. db/m-AL; cP < 0.05 vs. db/db-AL; dP < 0.001 vs. db/db-AL; eP < 0.05 vs. db/m IF (feeding); fP < 0.001 vs. db/m IF (feeding); gP < 0.05 vs. db/db IF (fasting). All OTUs (detected in at least 10% of the samples) from all samples per each group were used, irrespective of zeitgeber time. p., phylum.

