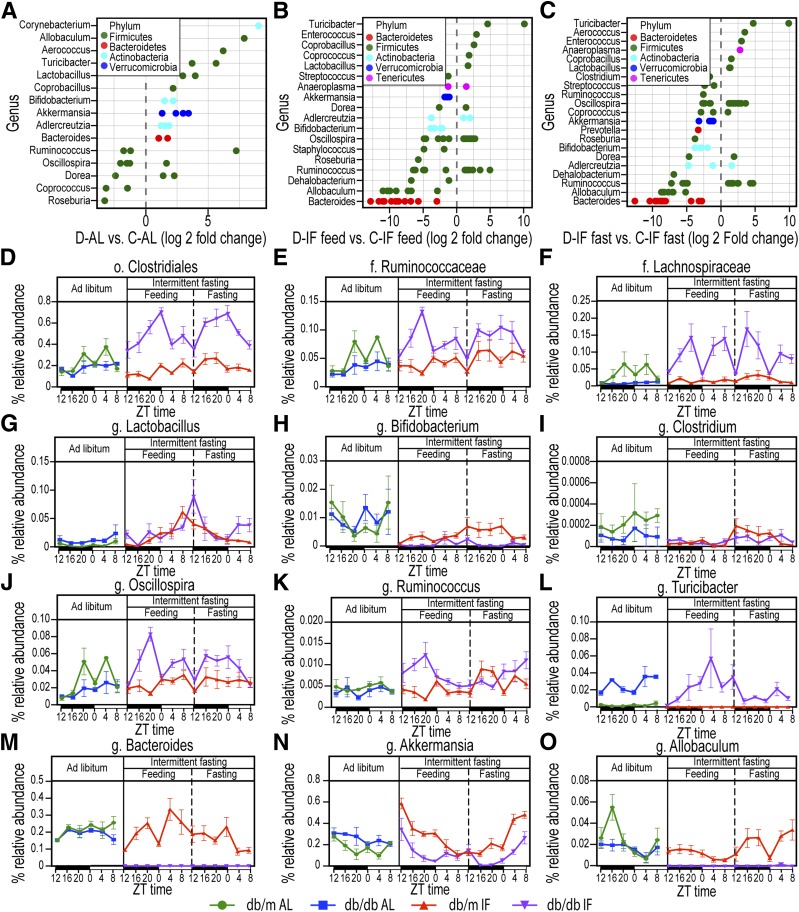
Figure 4.
IF effects on microbiome composition at the genus level. A: Genera that show statistically significant changes in db/db-AL vs. db/m-AL mice. B: Genera that were statistically different in db/db-IF vs. db/m-IF mice in the feeding phase. C: Genera that were statistically different in db/db-IF vs. db/m-IF in the fasting phase. Points are OTUs belonging to each respective genus. Features were considered significant if false discovery rate–corrected P value ≤0.05 and the absolute value of log2 fold change ≥1. D–O: Time course of relative bacterial abundances of selected taxa during the 48-h cycle of IF regimen are shown. ZT represents zeitgeber time, i.e., time when the lights went on. Diurnal oscillations in selected taxa and IF effects: o. Clostridiales (D), f. Ruminococcaceae (E), f. Lachnospiraceae (F), g. Lactobacillus (G), g. Bifidobacterium (H), g. Clostridium (I), g. Oscillospira (J), g. Ruminoccocus (K), g. Turicibacter (L), g. Bacteroides (M), g. Akkermansia (N), and g. Allobaculum (O). Data are sums of relative abundance of all OTUs within each genus ± SEM. f., family; g., genus; o., order.

