Figure 5.
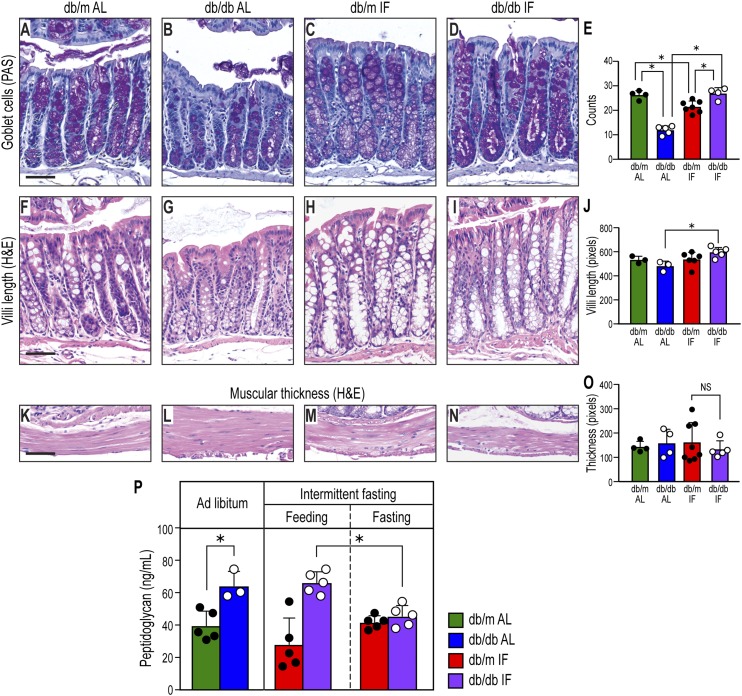
IF treatment affected gut morphology. A–D: Periodic acid Schiff (PAS) staining showing mucin-positive goblet cells. Diabetes reduced goblet cell number, but IF prevented this reduction. E: Quantification of goblet-positive cells. Data represent number of goblet cells/villus. *P < 0.05, n = 13–30 villi/group. F–I: Hematoxylin and eosin (H&E) staining of colon. The length of villi was reduced significantly with diabetes, but IF restored levels to normal. J: Quantification of the villi length, in pixels. *P < 0.05, n = 17–26 villi/group. K–N: Hematoxylin and eosin staining of the muscularis layer. O: Quantification of the muscularis width. Twenty measurements distributed evenly were done on each section, and data represent averages per section in pixels ± SD; n = 4–7 sections/group. In all cases, one section per mouse was analyzed. Scale bars: 50 μm. P: Peptidoglycan, a component of bacterial cell wall, was measured in plasma from the cohorts using ELISA. Data represent means ± SD (n = 3–5). *P < 0.05, two-way ANOVA.

