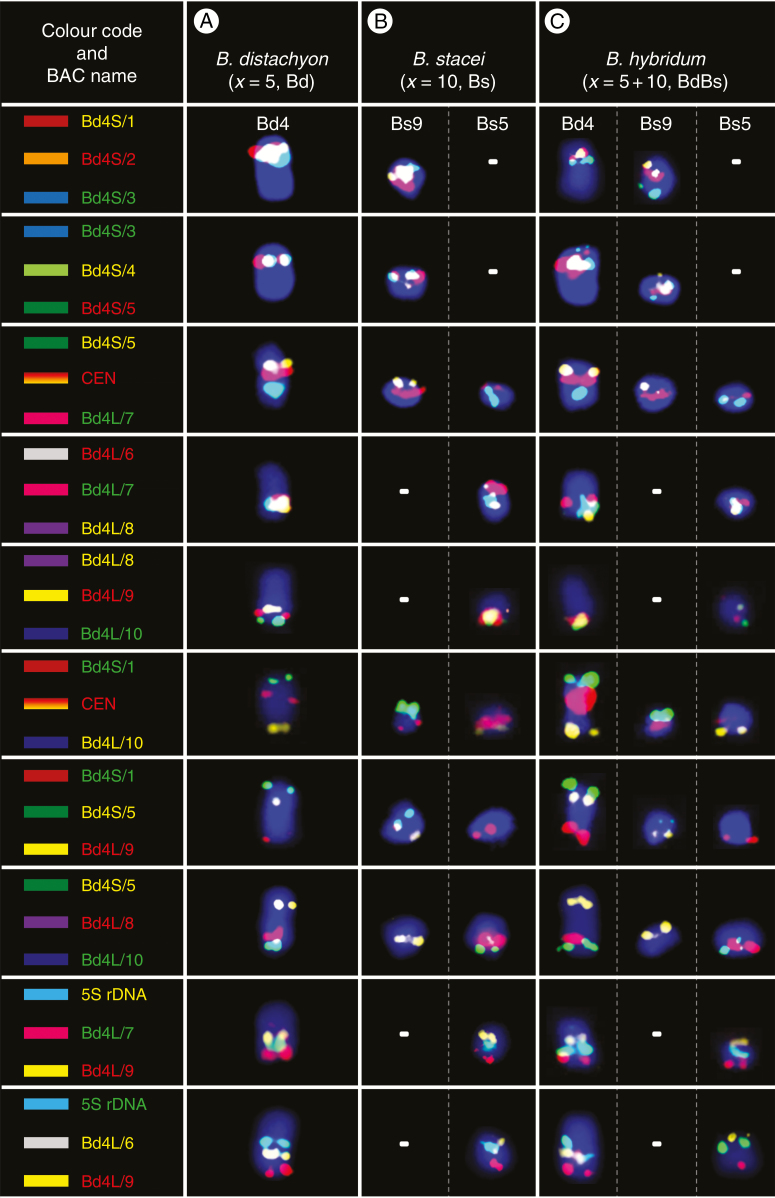
Fig. 6.
BAC–FISH-based comparative chromosome barcoding with the clones from chromosome Bd4 of B. distachyon (A) to chromosomes Bs9 and Bs5 of B. stacei (B) and Bd4, Bs9 and Bs5 of B. hybridum (C). Only one homologue from a pair is shown. The red, yellow and green BAC name text labels in the first column indicate the fluorochrome used (green, FITC; red, tetramethylrhodamine; yellow [false colour], Alexa Fluor 647). Chromosomes were stained with DAPI (blue). The coloured bars on the left and BAC names that were assigned to specific clones correspond to those on cytogenetic maps in Fig. 7.

