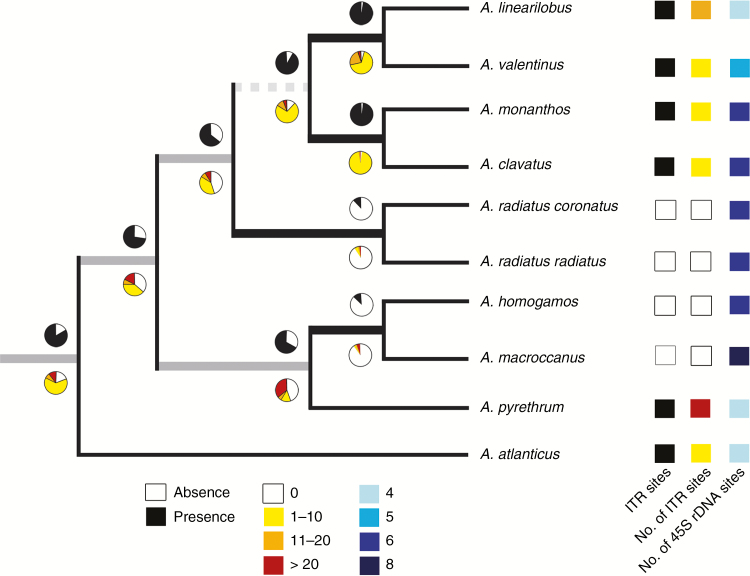
Fig. 5.
Maximum likelihood reconstruction of ancestral character states for two characters, presence/absence of ITR sites and number of ITR sites in Anacyclus species, using the phylogenetic tree in Oberprieler (2004) with a slight modification (Heliocauta atlantica, the sister group to Anacyclus, is labelled as A. atlanticus). Pie charts illustrate the relative likelihood for each character state at each node under the specified model of evolution (Mk1 model, in this study). Bootstrap support for the nodes obtained in the original study of Oberprieler are indicated as follows: black (90–100 %), grey (71–89 %), dashed (<70 %). The presence of ITR sites, the ranges of modal numbers of ITR sites and the number of 45S rDNA loci (Rosato et al., 2017) for each species are indicated on the right margin.

