
FIGURE 1.
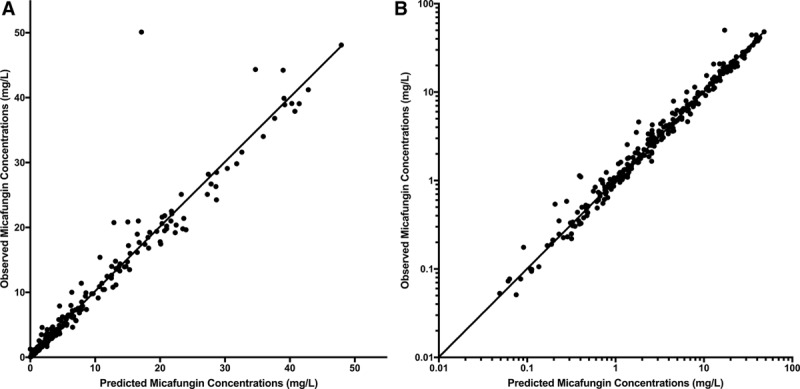
Observed versus posterior predicted concentrations (mg/L) from the final model after the Bayesian step on a linear scale (A; r2 = 0.945; slope = 0.995; 95% confidence interval [CI]: 0.967–1.02; intercept = 0.24; 95% CI: −0.104 to 0.584) and on a log scale (B; r2 = 0.947; slope = 0.946 95% CI: 0.92–0.972; intercept = 0.0496; 95% CI: 0.0284–0.0709). Dotted line is line of unity where observed concentrations equal predicted concentrations.