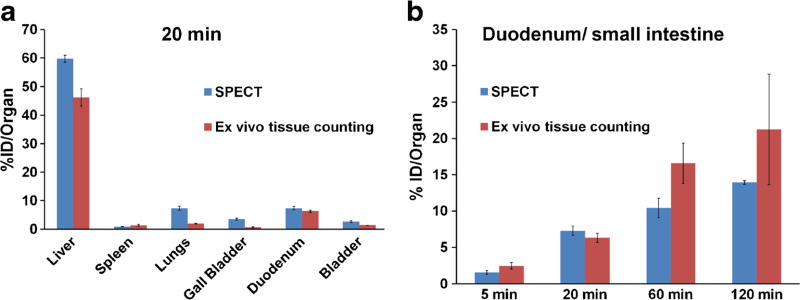
Fig. 4.
Ex vivo tissue counting and SPECT biodistribution. a Comparison of both biodistribution data reporting the uptake of [99mTc]GVs in major organ/tissues 20 min following injection. b [99mTc]GVs uptake in the duodenum (SPECT) and small intestine (ex vivo tissue counting) showing a similar increase at corresponding time points (4 time points, n = 3 per time point). Each SPECT reported values were calculated using the segmentation results multiplied by the volume of the corresponding segmented organ. Data are reported in %ID/organ ± SEM (Ex vivo counting data is not normalized for weight, 4 time points, n = 3 per time point, SPECT n = 23, 55, 31, and 8 at 5, 20, 60, and 120 min, respectively.).

