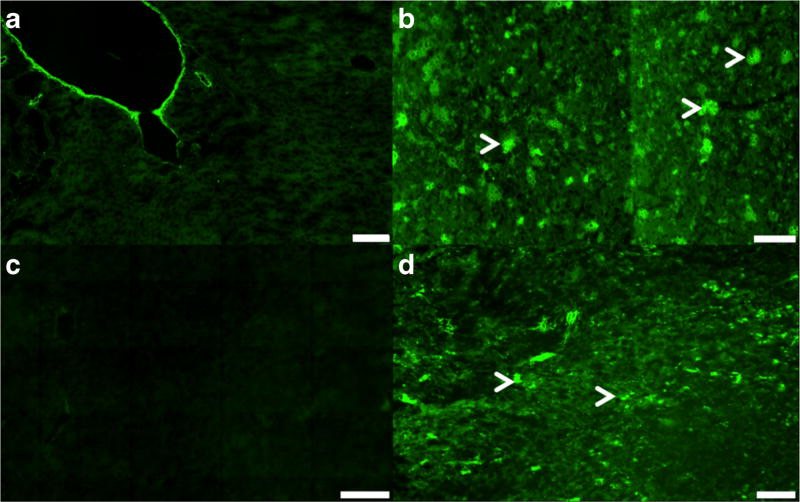
Fig. 6.
Fluorescence imaging of the liver and spleen tissues. Native GVs in a the liver and in c the spleen tissues showing only autofluorescence. Alexa 488 fluorophore tagged GVs in b the liver and d spleen tissues showing an increase green signal intensity. White arrows show clustering of Alexa488-GVs in both tissues. Scale bar is 100 µm (a–c) and 50 µm (d). Magnification: × 20 (a, c) and × 10 (b, d).

