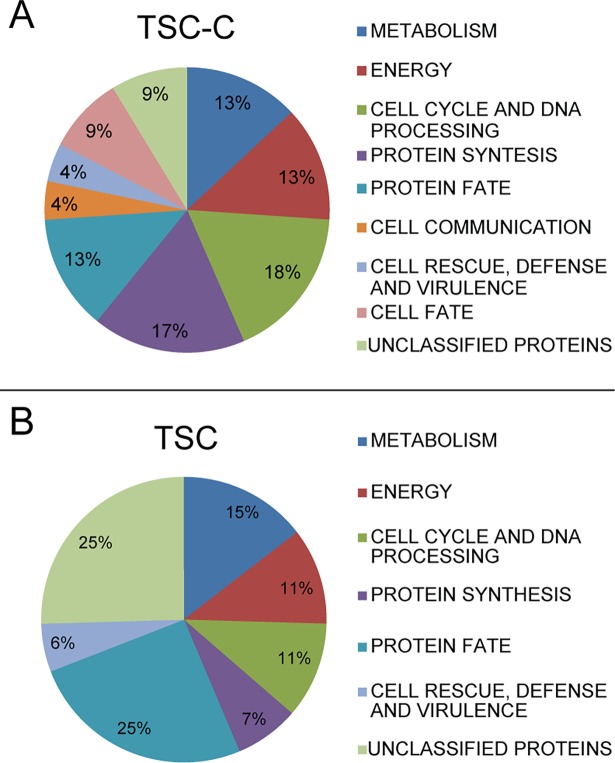
Fig 2. The graph indicates the statistically enriched MIPS functions.
Proteins that were bound to TSC-C and TSC. The functional classification was based on the MIPS functional annotation scheme. Each functional class is represented as a color-coded segment and expressed as a percentage of the total number of proteins.

