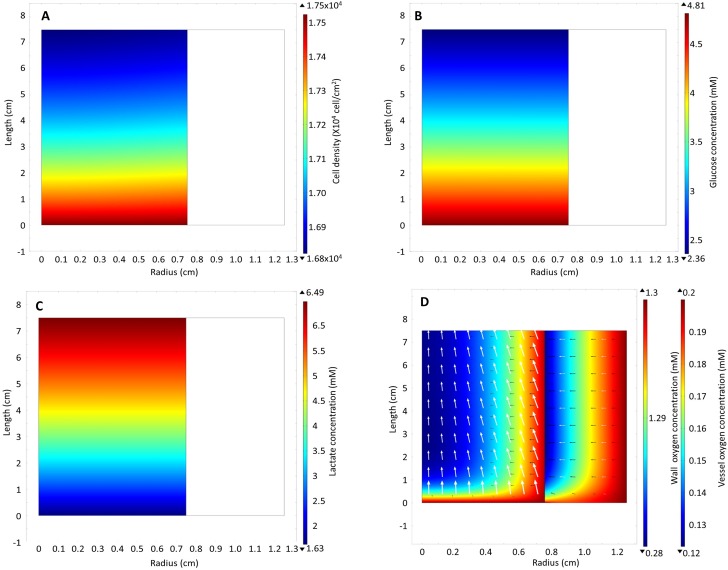
Fig 2.
Model results: heat map of (A) cell density, (B) glucose, (C) lactate and (D) oxygen concentration in the wall and in the vessel on day 7. The white arrows on the oxygen concentration heat map represent the direction of total flux of oxygen while the black arrows represent the direction of the diffusive flux.

