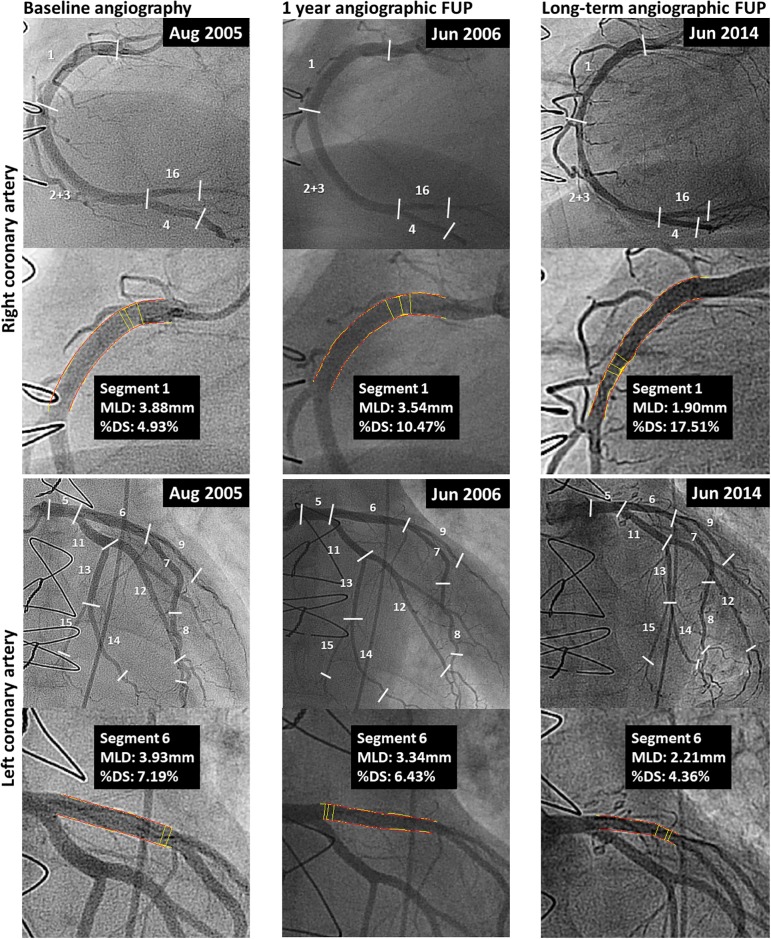
Fig 2. Serial 3-vessel quantitative coronary angiography analysis.
This figure shows the serial quantitative coronary angiography analysis within matched regions of all coronary artery segments at baseline, at 1 year follow-up, and at latest available angiographic follow-up. Coronary artery segments were classified according to the modified AHA/ACC classification. MLD indicates minimal lumen diameter; %DS, percent diameter stenosis.

