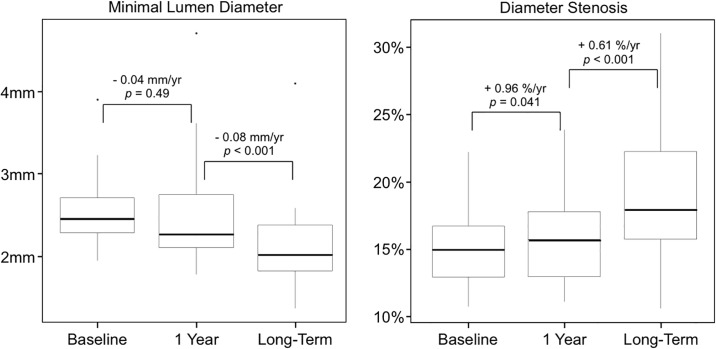
Fig 3. Serial 3-vessel quantitative coronary angiography analysis.
Box-plot representation of minimal lumen diameter and maximal percent diameter stenosis at baseline (median 0.14 years [0.12 to 0.16], at 1 year (median 1.17 years [1.14 to 1.20]) and at long-term angiographic follow-up (median 8.61 years [8.24 to 8.99]) after HTx. Lower and upper box edges are the quartiles and thick line is the median.

