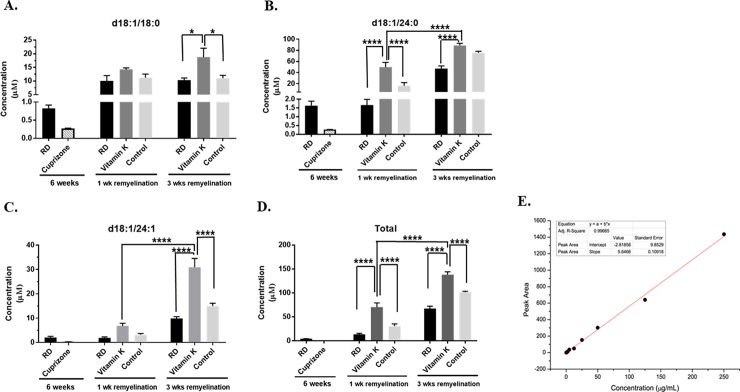
Fig 3. Vitamin K enhances the production of brain sulfatides.
The levels of individual species of sulfatides, as well as the total sulfatides levels were determined by mass spectrometry analysis. Sulfatide levels were determined in brains isolated from mice that were fed the following diets: a 0.3% cuprizone- containing diet for 6 weeks (Cuprizone), regular diet for 6 weeks (RD), cuprizone for 6 weeks followed by 1 week remyelination on a regular diet (RD, 1 wk remyelination), cuprizone for 6 weeks followed by 1 week remyelination on a vitamin K-deficient diet with vitamin K injections (phylloquinone, 1mg/10g of body weight, three times a week, Vitamin K, 1wk remyelination), cuprizone for 6 weeks followed by 1 week remyelination on a vitamin K- deficient diet with saline injections (Control, 1wk remyelination), cuprizone for 6 weeks followed by a regular diet for 3 weeks (RD, 3 wk remyelination), cuprizone for 6 weeks followed by 3 weeks of remyelination on a vitamin K-deficient diet with vitamin K injections (1 mg/ 10 g body weight, Vitamin K, 3 wk remyelination), and cuprizone for 6 weeks followed by 3 weeks of remyelination on a vitamin K–deficient diet with saline injections (Control, 3 wk remyelination). Sulfatides were quantified with LC-MS/MS using linear regression analysis of integrated peak area versus the concentration of a sulfatide standard. Individual species of d18:1/18:0 (A.), d18:1/24:0 (B.), d18:1/24:1 (C.) sulfatides, and the total concentration of the sulfatide species (D.) are shown. n = 5 mice per group, and concentration (μM) is expressed as mean ± SEM. *P < 0.05, **P < 0.01, ***P < 0.001, ****P < 0.0001. Please see the text for the actual P-values. E. Calibration curve used for the determination of sulfatide concentration in mice brains. The calibration curve was constructed using standards diluted to the following concentrations: 0.25, 0.50, 1.25, 2.50, 5.00, 12.5, 25.0, 50.0, 125, 250 μg/mL.

