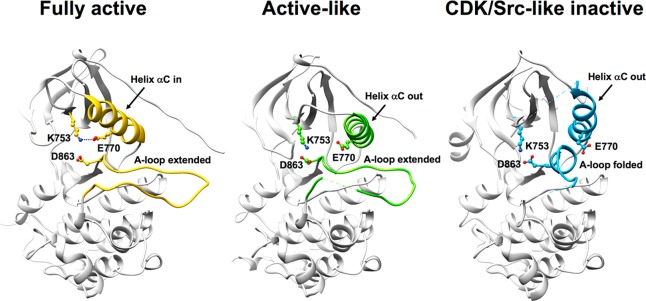
Figure 1.
Ribbon representations based on crystallographic data showing EGFR in the fully active form (PDB 1M17, left), HER2 in the active-like form (PDB 3PP0, middle), and EGFR in the CDK/Src-like inactive form (PDB 1XKK, right). Key structural indicators that help define the three different states include the rotation of the αC helix, the A-loop, and D863 in the DFG-motif as highlighted. Residue labels based on HER2 numbering. K753, E770, and D863 are equivalent to K745, E762, and D855 in EGFR.

