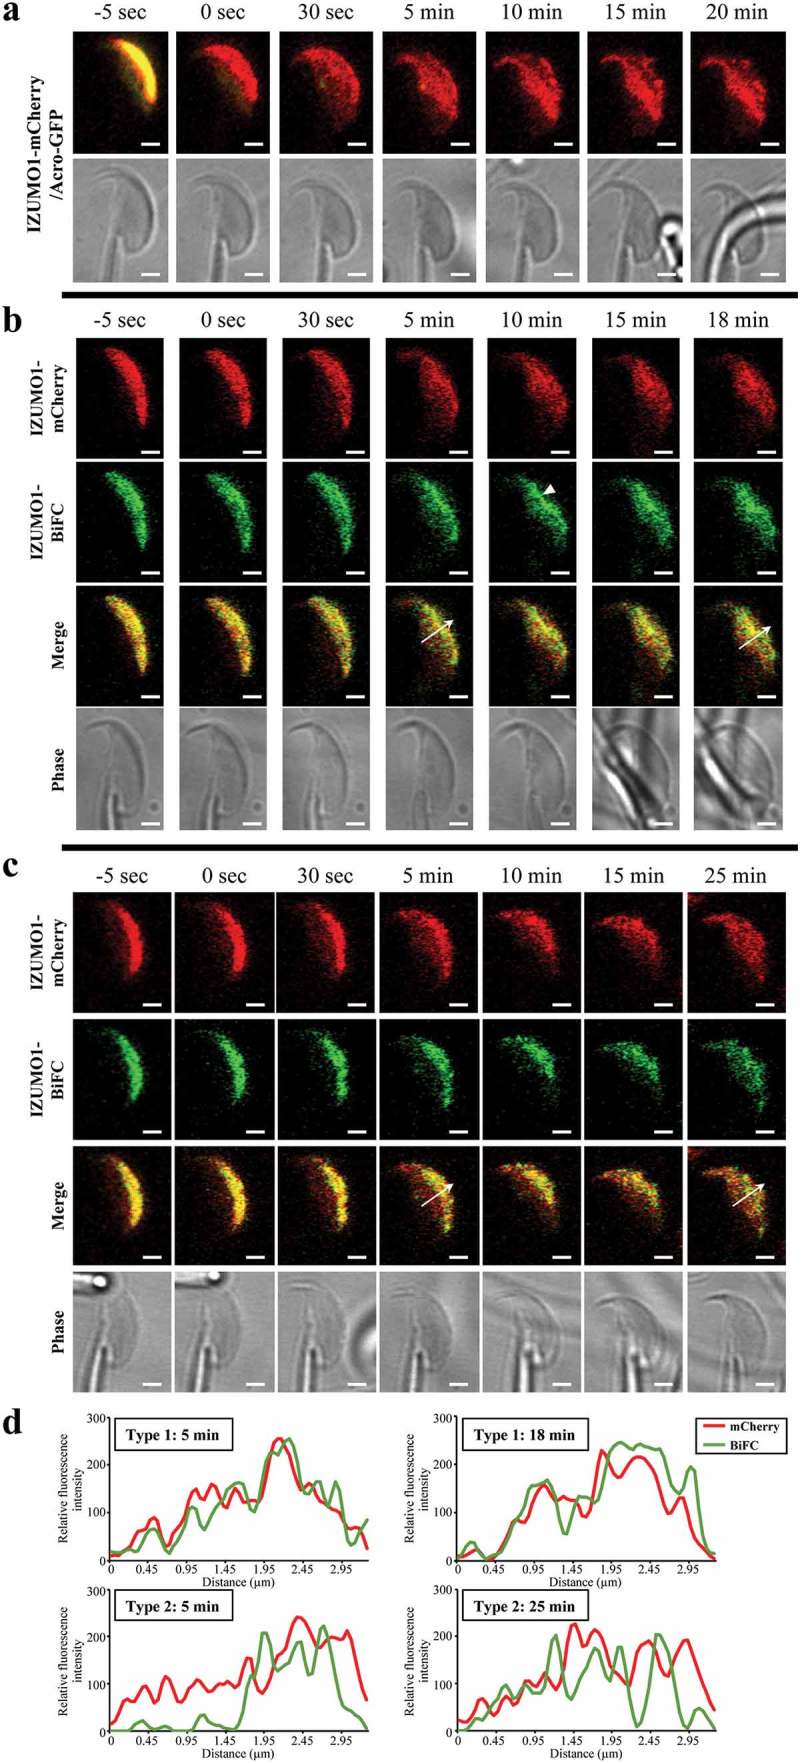
Figure 2.

Time-lapse of IZUMO1 oligomerization upon the AR. (a) Translocation of IZUMO-mCherry. In Acro-GFP/IZUMO1-mCherry double transgenic mice, mCherry and GFP fluorescence images were captured before and after the AR. Immediately after the AR, no GFP signals were detected, indicating acrosomal exocytosis, and translocation of IZUMO1-mCherry to the EQ was observed. (b) Type 1 movement of IZUMO1-BiFC. Appearance of BiFC fluorescence (green) followed IZUMO1-mCherry (red) almost simultaneously. Arrow head indicates the region where IZUMO1 was clustered. (c) Type 2 movement of IZUMO1-BiFC. Formation of BiFC signals (green) was delayed compared to translocation of IZUMO1-mCherry (red) to the EQ after the AR. Scale bar, 2 μm. (d) Quantification of b and c. Fluorescence intensity was measured at an arrow in b and c. In Type 2 movement, BiFC was largely devoid in the EQ at 5 min, and caught up with mCherry signals over 25 min.
