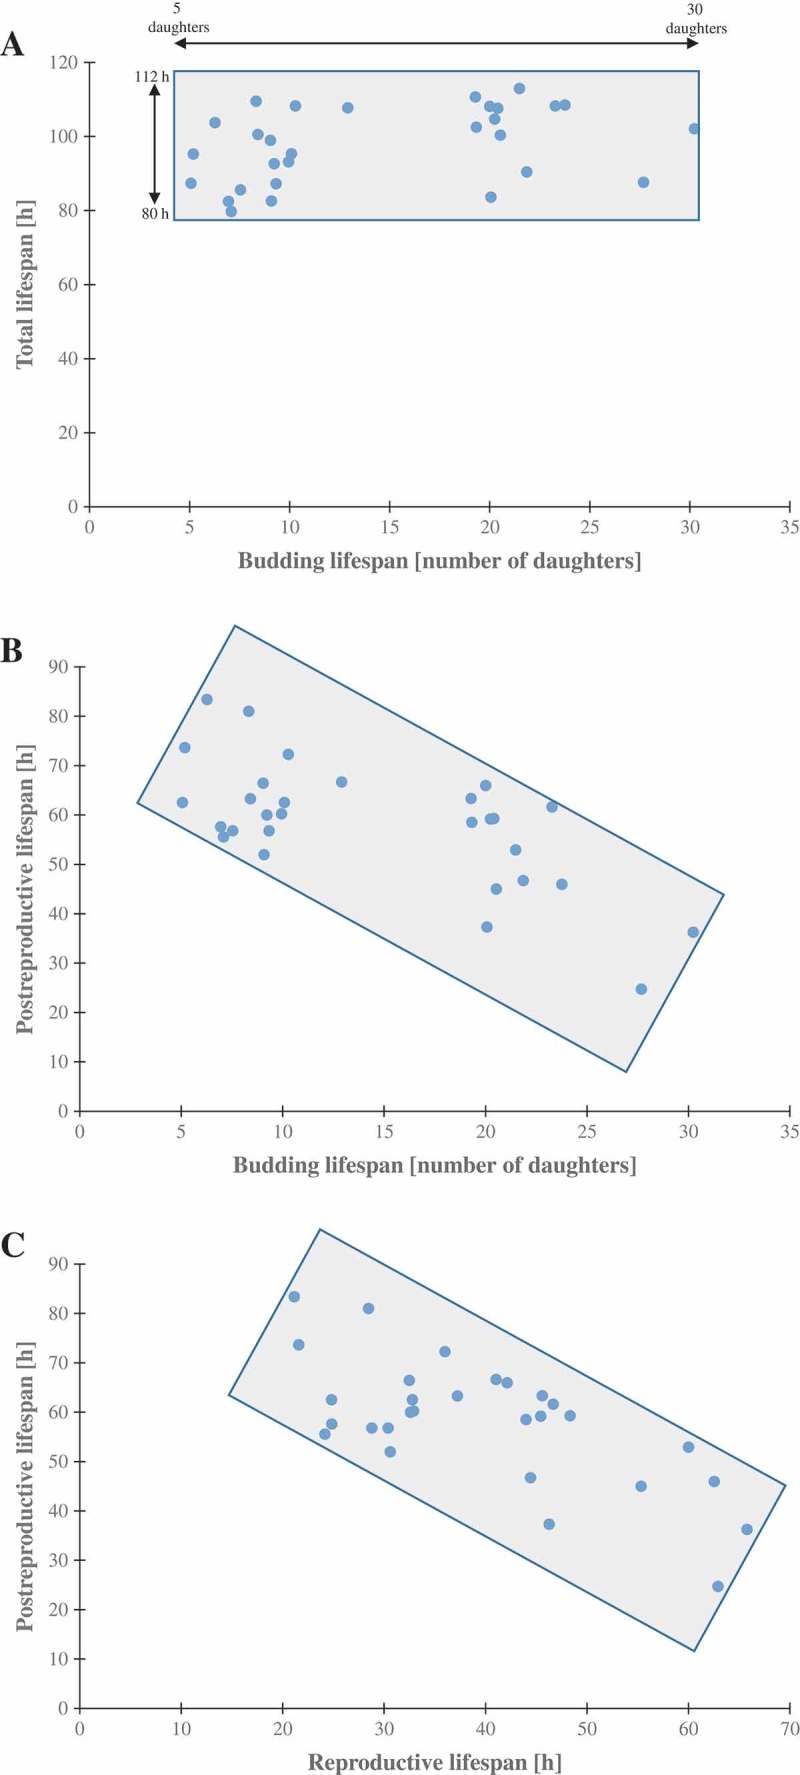
Figure 3.

Scatter plots present relationship between: the mean number of daughters (budding lifespan) and the mean lengths of the total lifespan (a), the mean number of daughters (budding lifespan) and post-reproductive lifespan (b), reproductive lifespan and post-reproductive lifespan (c). Each dot represents strains or clones.
