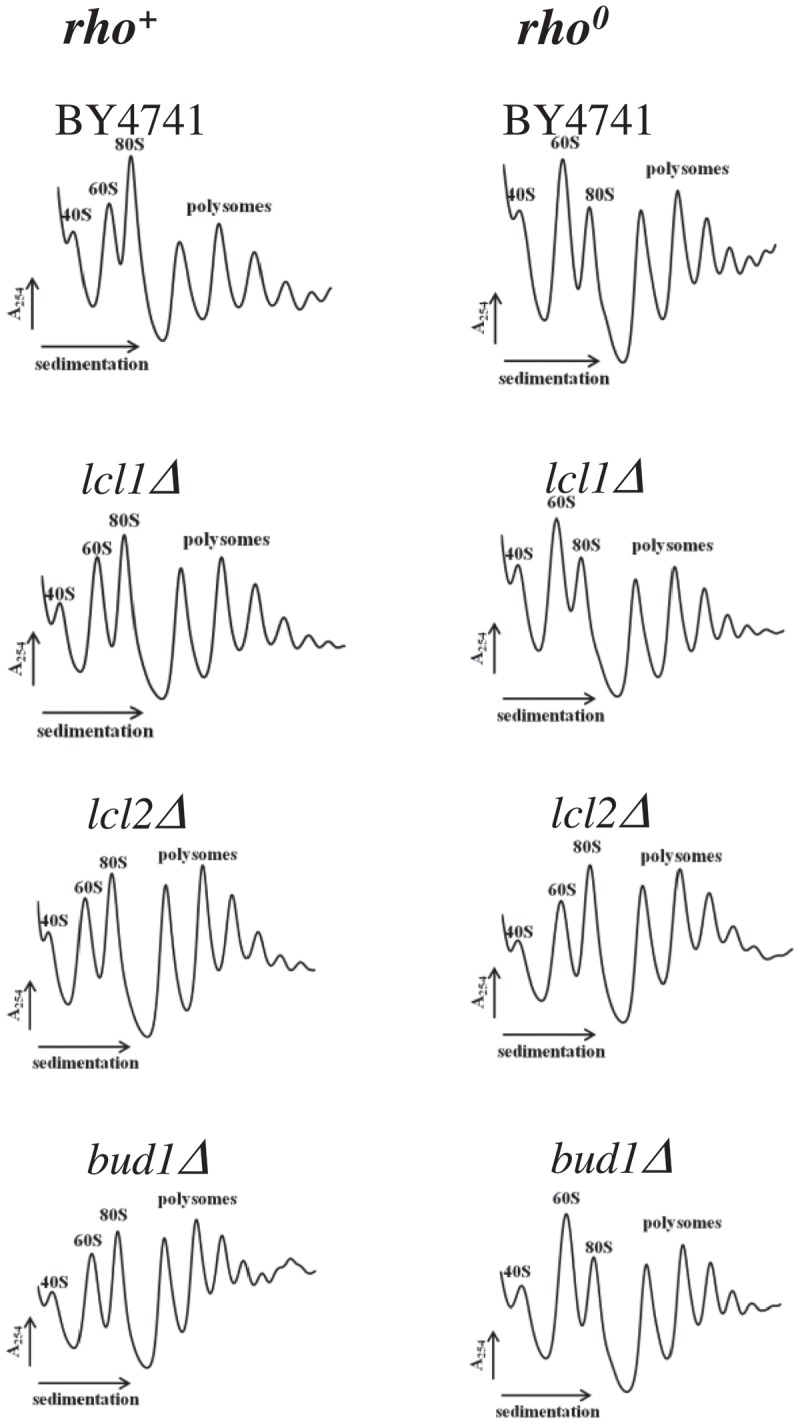
Figure 7.

Polysome profile analyses using equal numbers of cells. The positions of individual ribosomal subunits are indicated in all graphs. More details about the polysome profile are available on supplementary data 3.

Polysome profile analyses using equal numbers of cells. The positions of individual ribosomal subunits are indicated in all graphs. More details about the polysome profile are available on supplementary data 3.