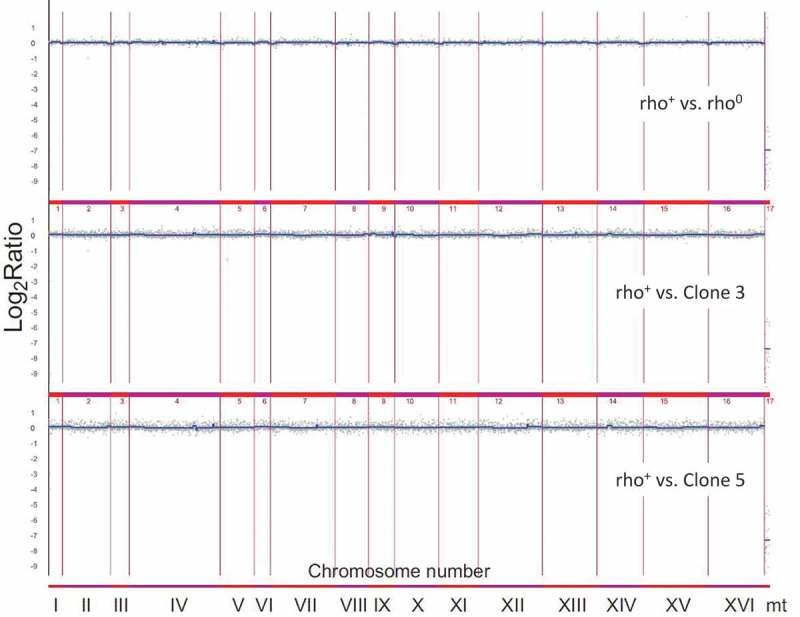
Figure 8.

Analysis of the variability in the gene copy number of strains bud1Δ rho+, rho° and two clones 3 and 5 using array CGH. Each gray dot represents the value of the log2 ratio for an individual gene. Blue lines were provided to emphasise the most accented differences (DNA losses and gains).
