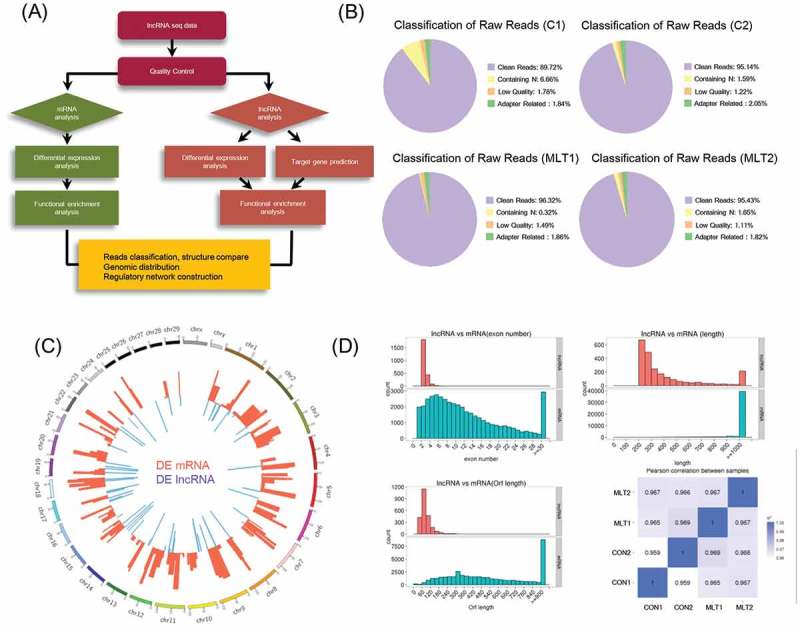
Figure 3.

mRNA and lncRNA sequencing data comparison and distribution. (A) Detailed schematic diagram of the lncRNA sequencing pipeline used in this study. (B) Raw reads classification and distribution of all samples in this study. (C) Genome wide distribution of differentially expressed mRNAs and lncRNAs. Chromosomes were labeled with serial number (scale Mb) and the red and blue histogram indicates p-value of differentially expressed mRNAs and lncRNAs individually. (D) Comparison of exon number, transcript length, open reading frame length between lncRNAs and mRNAs. Pearson correlations between samples were also analyzed.
