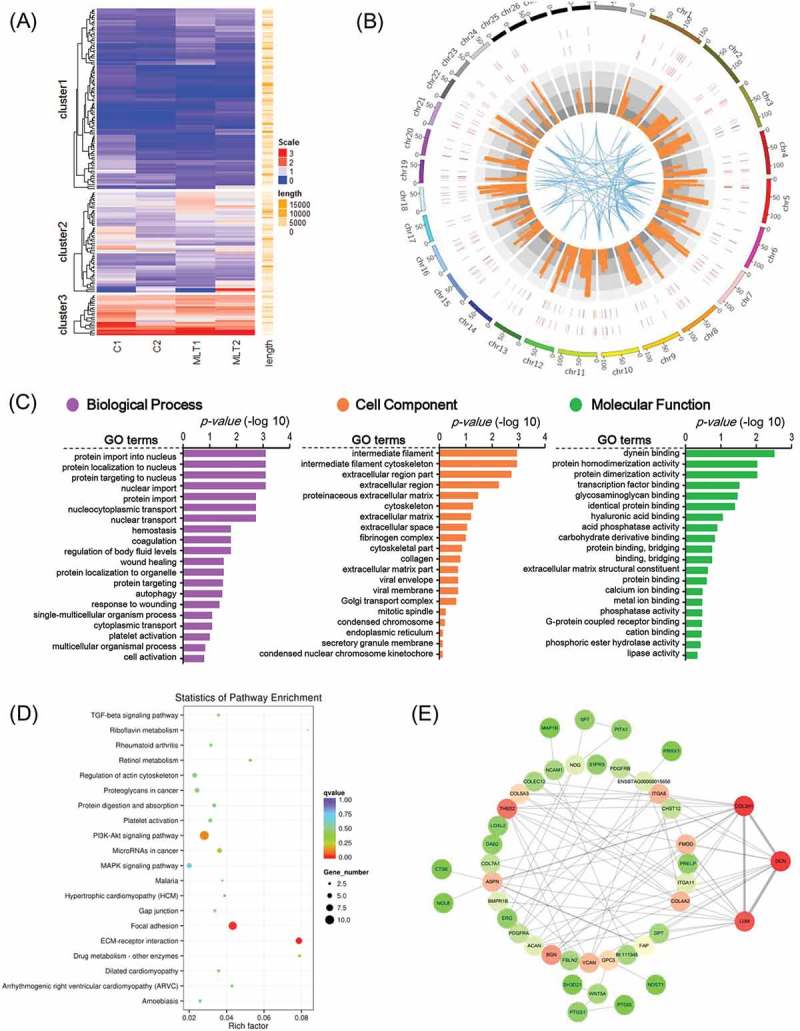
Figure 4.

GO analysis and KEGG enrichment of differentially expressed mRNAs. (A) Heatmap of melatonin mediated differentially expressed mRNAs, red indicated an increased expression, and blue indicated a decreased expression. (B) Genome wide visualization of protein interactive network by Circos. From inside to outside, blue links indicate protein-protein interactive according to STRING database, orange histogram indicates p-value of differentially expressed mRNAs, combined heatmap of differentially expressed mRNAs between samples, the outer track indicates the control group and the inner track indicates melatonin exposed group. (C) GO analysis of differentially expressed mRNAs, the top 20 GO terms were shown. (D) KEGG pathway enrichment analysis of differentially expressed mRNAs, the top 20 pathways were illustrated as bubble plot. The size of the bubble indicates gene number and the color indicates q-value. (E) Protein to protein interactive network of differentially expressed mRNAs visualized Cytoscape. The color indicates node degree.
