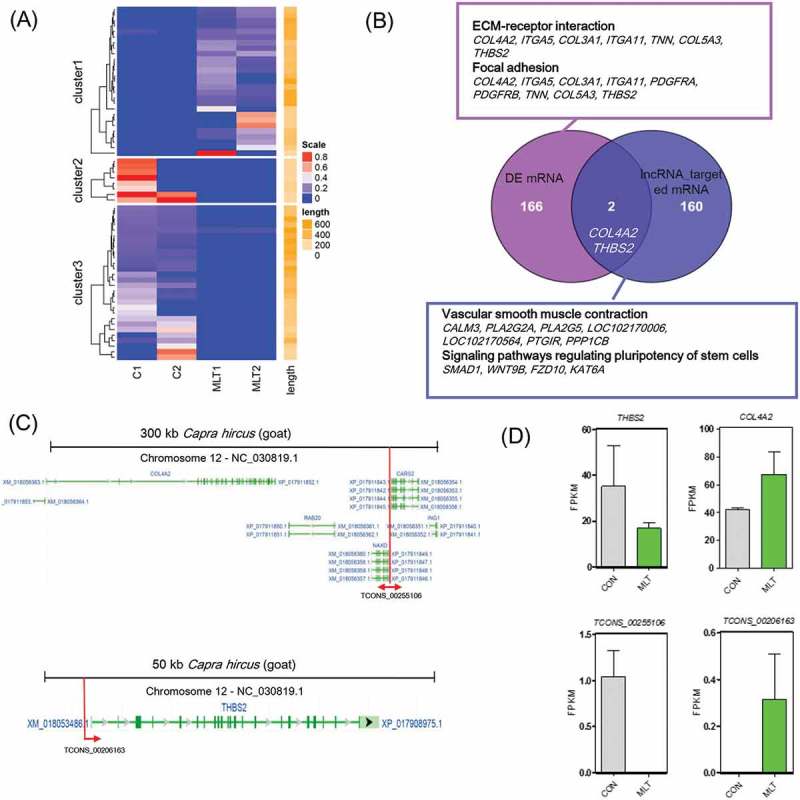
Figure 5.

lncRNA analysis perturbed by melatonin exposure. (A) Heatmap of differentially expressed lncRNAs, red indicated an increased expression, and blue indicated a decreased expression. (B) Veen diagram comparison of differentially expressed mRNAs and differentially expressed lncRNA cis targeted mRNAs. The box indicates KEGG enrichment of its corresponding population. (C) Genomic location of lncRNA TCONS_00255106 and TCONS_00206163 and their potential cis targeted mRNAs. (D) Relative expression (FPKM) comparison of lncRNA TCONS_00255106, TCONS_00206163 and mRNA THBS2, COL4A2.
