
Figure 1.
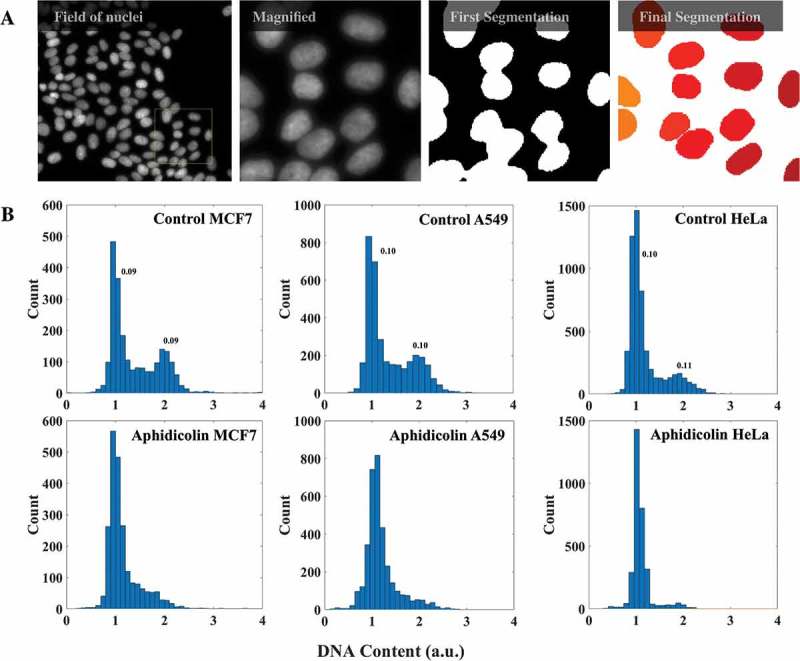
DNA content analysis with imaging. (a) A field of HeLa cells with DNA stained with DAPI is shown. The yellow box is shown magnified on the right. From images like these the nuclear masks were obtained from a fully automated Matlab program for evaluation of DNA content. (b) DNA content histograms of mock and aphidicolin treated MCF7 (2250 cells), A549 (3480 cells) and HeLa cells (3190 cells). Numbers on the peaks are corresponding coefficients of variation. (See also Supplementary Figure S1.).