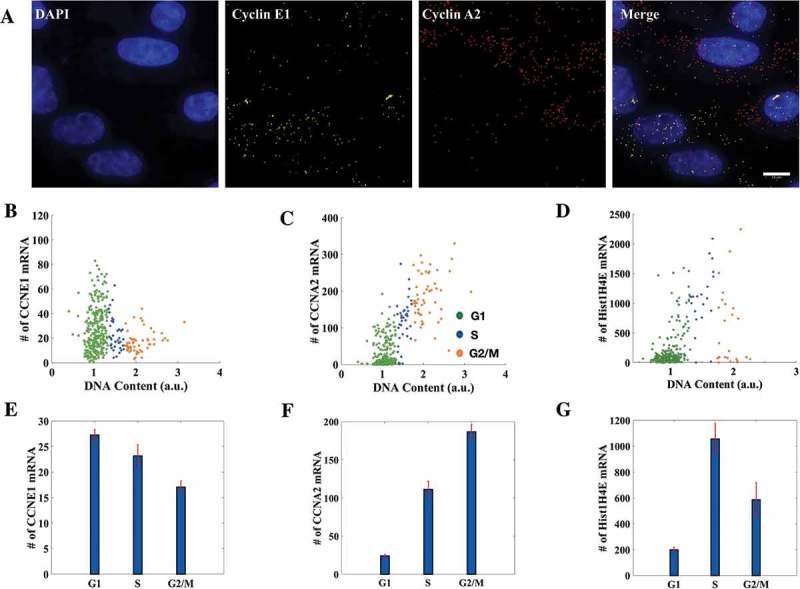
Figure 2.

Cell cycle staging from imaging conforms with the expression profiles of histone and cyclin mRNAs. (a) smFISH was done for Cyclin E1 and Cyclin A2 simultaneously on the same population of HeLa cells (376 cells in total. Scale bar: 10μm). (b, c, d) Distributions of Cyclin E1 (CCNE1), Cyclin A2 (CCNA2) and Histone H4 (Hist1H4E) mRNAs with respect to DNA content. Each dot represents an individual cell. (E, F, G) Mean mRNA numbers for Cyclin E1, Cyclin A2 and Histone H4 in respective cell cycle phases. The mean mRNA counts for Cyclin E1 for cells in G1, S and G2 phases of the cell cycle were 27 ± 1, 23 ± 2 and 17 ± 1 respectively while for Cyclin A2 they were 24 ± 2, 111 ± 11 and 186 ± 9 and for Histone H4 they were 199 ± 20, 1057 ± 120 and 586 ± 132. On average, G2/M cells had the highest number of Cyclin A2 mRNA and lowest of Cyclin E1 mRNA and vice versa for G1 cells. Histone H4 mRNA number peaked in the S phase as obtained from the analysis (284 cells in total). (Errorbars are standard errors. See also Supplementary Figure S2-A and S2-B.).
