
Figure 3.
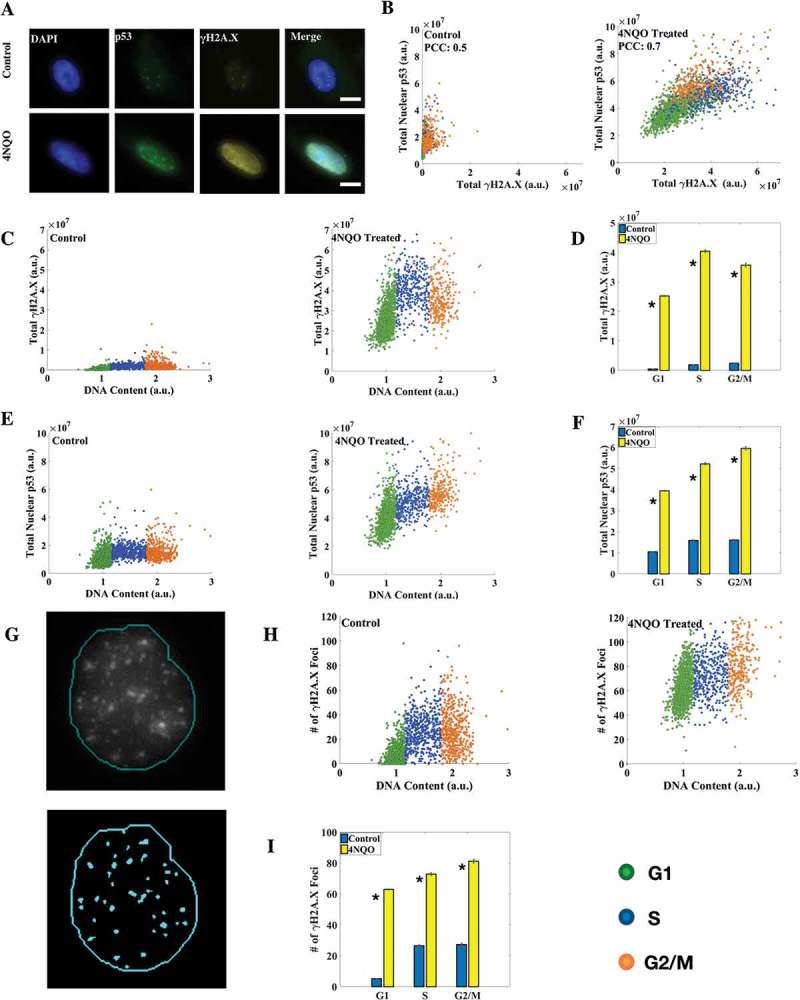
Correlation between nuclear p53 and γH2A.X levels increases upon DNA damage. (a) Immunofluorescence (IF) for p53 and γH2A.X in A549 cells (scale bar: 10 μm). (b) Correlation coefficient between γH2A.X and p53 levels increased in DNA damaged cells. (c, e) Distribution of γH2A.X and p53 with DNA content in control and 4NQO-treated cells. γH2A.X levels linearly increased in control cells while they peaked in the S phase in DNA damaged cells. (d) Mean levels of total nuclear γH2A.X. A large induction of γH2A.X in DNA damaged cells in all the phases of the cell cycle was observed. (f) Mean levels of total nuclear p53. Significant induction of nuclear p53 in DNA damaged cells was observed. (g) Results of the γH2A.X foci detection algorithm in Matlab. Most of the observed foci were identified. The thin line represents the nuclear boundary. (h) γH2A.X foci number distribution in control and DNA damaged cells. (i) Average number of γH2A.X foci in the respective phases of the cell cycle. The fold change here is smaller than that for γH2A.X protein levels, as larger and more intense foci are formed in damaged cells without affecting foci count. All differences are significant with p-value < 0.05 (K-S test). (Errorbars are standard errors. The analysis was done on 5000 cells for each plot. See also Supplementary Figures S3 and S4.).