
Figure 4.
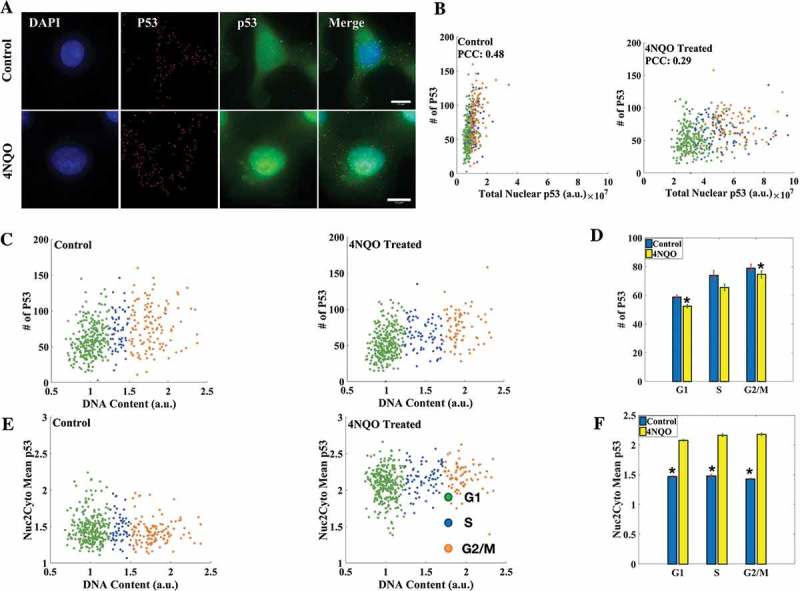
Transcriptional and translational regulation of P53. (a) smFISH for P53 RNA was combined with IF for p53 protein in A549 cells (scale bar: 10 μm). (b) Correlation between P53 mRNA number and protein levels decreased in DNA damaged cells. (c, e) Cell cycle distribution of P53 mRNA number and nuclear-to-cytoplasmic ratio of mean levels of p53. (d) Mean P53 mRNA counts in DNA damaged and control cells in respective cell cycle phases. mRNA count is consistently lower in DNA damaged cells. The average numbers of P53 mRNA in control cells in G1, S and G2/M phases of the cell cycle are 59 ± 1, 73 ± 3, 79 ± 3 while for DNA damaged cells they are 52 ± 1, 65 ± 2, 74 ± 3. (f) Nuclear to cytoplasmic ratio of mean levels of p53 protein goes up in DNA damaged cells and remains constant throughout the cell cycle in both DNA damaged and control cells. All differences are significant with p-value < 0.05 (K-S test). (Errorbars are standard errors. The analysis was done on 410 cells each. See also Supplementary Figures S5, S6-A, S6-B and S7.).