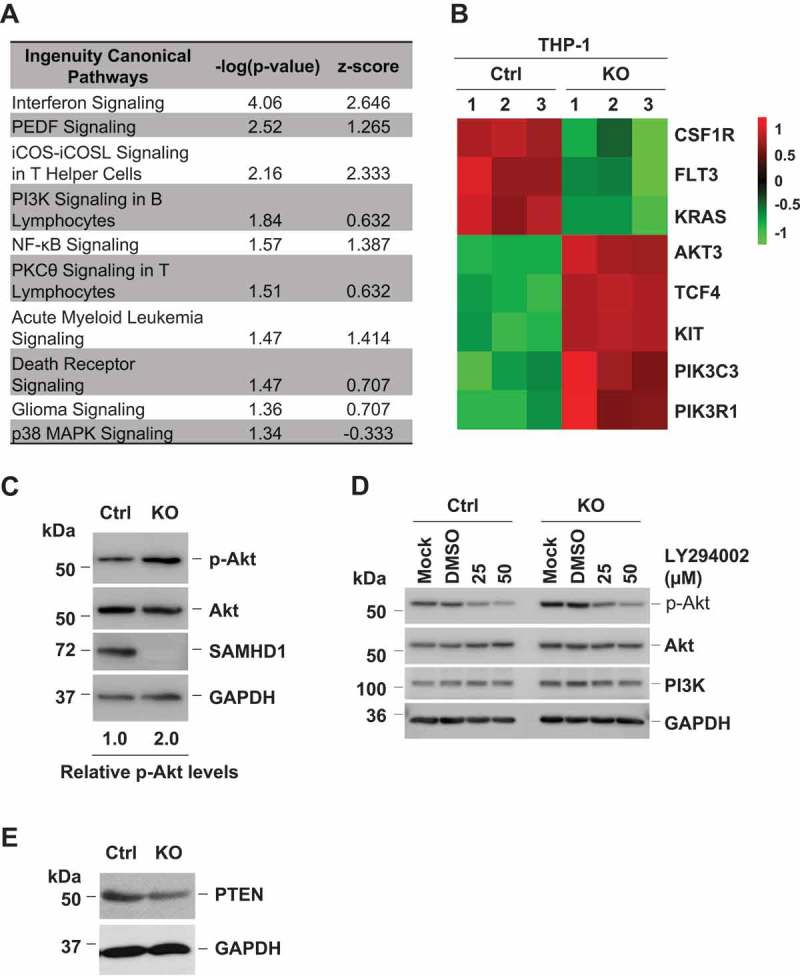
Figure 2.

SAMHD1 KO enhances PI3K activity and reduces PTEN levels. (a) Significantly enriched pathways in THP-1/KO cells versus control cells were identified by ingenuity pathway analysis (IPA) of the microarray data. Statistically significant pathways are shown with their respective p values and z-scores. Pathway up-regulation is indicated by a positive z-score, while down-regulation is indicated by a negative z-score. PEDF, serpin family F member 1; iCOS, inducible T cell costimulator; iCOSL, inducible T cell costimulator ligand; PKCθ, protein kinase C theta; MAPK, mitogen-activated protein kinase. (b) Activation of the AML signaling in THP-1/KO cells relative to control (Ctrl) cells by microarray analysis. Each cell line was analyzed in three biological replicates as indicated by sample numbers 1–3. The heatmap shows mRNA levels of differentially expressed key regulators of the AML signaling pathway. Up-regulated genes are shown in red, down-regulated genes are shown in green (the numbers next to the legend represent raw Z-score). CSF1R, colony stimulating factor 1 receptor; FLT3, Fms related tyrosine kinase 3; KRAS, Kirsten ras oncogene homolog; AKT3, AKT serine/threonine kinase 3; TCF4, transcription factor 4; KIT, KIT proto-oncogene receptor tyrosine kinase; PIK3C3, phosphatidylinositol 3-kinase catalytic subunit type 3; PIK3R1, phosphoinositide-3-kinase regulatory subunit 1. (c) THP-1 control (Ctrl) and SAMHD1 KO cells were analyzed for the indicated protein expression by immunoblotting. The levels of phosphorylated AKT (p-AKT) expression were quantified by densitometry after normalization for total AKT and GAPDH. (d) THP-1 control and SAMHD1 KO cells were treated with LY294002 or DMSO (vehicle control of LY) or left untreated (Mock), and then analyzed for the indicated protein expression by immunoblotting. GAPDH was a loading control. (e) PTEN protein levels are lower in THP-1/KO cells compared to control (Ctrl) cells. Panels show representative results from three independent experiments.
