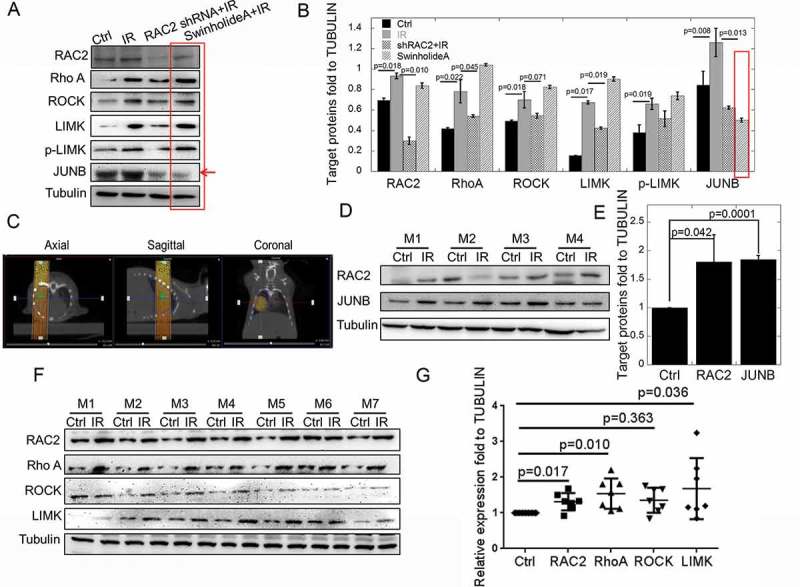
Figure 3.

The in vivo and in vitro expressions of RAC2 and Rho GTPase pathway proteins after exposure to X-ray irradiation.
(a) The expression of RAC2, RhoA, ROCK, LIM kinase, and JUNB were measured by western blotting. (b) The grayscale analyses of RAC2, RhoA, ROCK, LIM kinase, and JUNB. (c) The target area of X-ray exposure using computed tomography as guidance. (d) The expression of RAC2 and JUNB were measured by western blotting in mice (n = 4). (e) The grayscale analyses of RAC2 and JUNB in mice (n = 4). (f) The expressions of RAC2, RhoA, ROCK, LIM kinase, and JUNB were measured by western blotting in mice (n = 7). (g) The grayscale analyses of RAC2, RhoA, ROCK, LIM kinase, and JUNB in mice (n = 7). The error bars denote the mean±SE from three independent experiments.
