. 2018 Aug 6;7:e36851. doi: 10.7554/eLife.36851

Figure 1. Electron cryo-tomography of mammalian centrioles.

(a) Chinese hamster ovary (CHO) centrioles were imaged using electron cryo-tomography. The mother centriole [M] was decorated with peri-centriolar material along its entire length, while the daughter centriole [D] appeared less well decorated, especially at the distal end. Proximal and distal ends of the centriole are denoted ‘p’ and ‘d’, respectively. (b) Sub-volume averaging of CHO centrioles generated a map with triplet microtubules, consisting of a complete 13-protofilament A-tubule, and 10-protofilament B- and C-tubules. Both parts of the A-C linker (green double arrowheads) that connects adjacent triplets were obvious in the map, as was the pinhead (gold arrow) attached to protofilament A03. Densities binding to the lumenal surface of the microtubules were seen binding protofilaments A09/A10, B01/B02, and C01/C02. (c) High contouring of the triplet map showed the core structures that were present in the majority of all sub volumes. The absence of the A-C linker and pinhead indicated that they were at less than 100% occupancy in the map. The asterisk (*) denotes the likely site of the microtubule seam between protofilaments A09 and A10. This gap between protofilaments A09 and A10 was straddled by an A-tubule MIP (blue double arrowhead), a MIP that was present at high occupancy in the map. Scale bars are 100 nm in (a), and 25 nm in (b) and (c).

Figure 1.

Figure 1—figure supplement 1. Checking for centriole periodicities.

Figure 1—figure supplement 1.

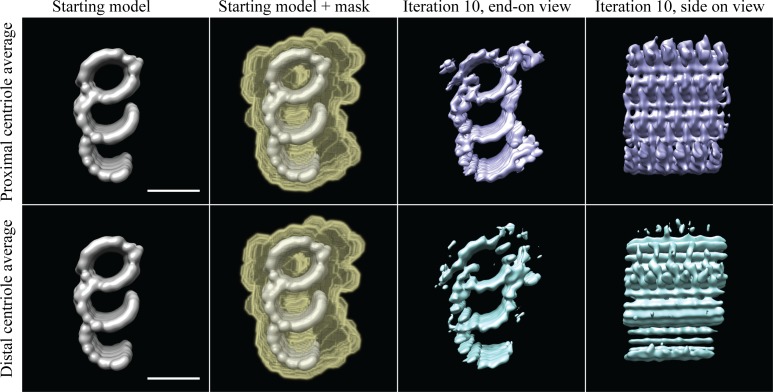
Column 1 contains the filtered model to which the subvolumes were aligned, column 2 indicates how the data were masked, column 3 shows an end-on view after a coarse alignment, and column 4 shows a side-on view of the average in column 3. The top four panels are the proximal CHO centriole data, while the bottom four panels are the distal CHO centriole data. Using the filtered model, the proximal and distal subvolumes align independently to give averages where all the densities at this resolution are represented within a 24 nm segment of the TMT. Scale bar is 25 nm.
Figure 1—figure supplement 2. Gold standard FSC resolution determination.

Figure 1—figure supplement 2.

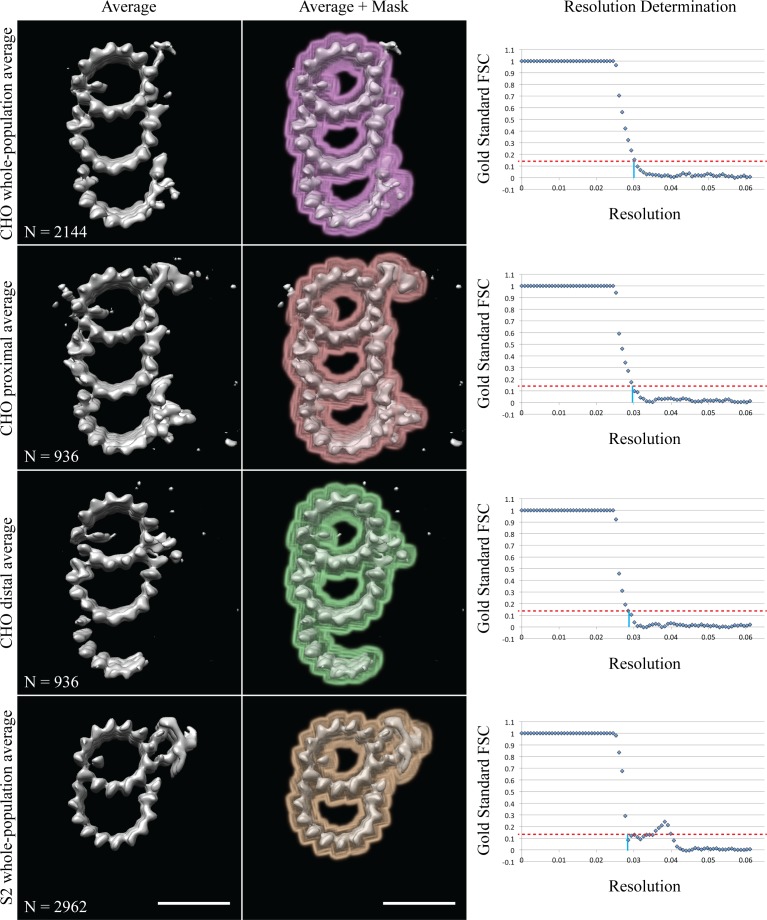
Column 1 contains the average maps, column 2 how the data were masked, and column 3 shows the gold standard FSC plots. The 0.14 cutoff is indicated by the dashed-red line, the intercept with the X-axis is marked by a solid-blue line. Each row is labeled on the left. The inset shows the number of subvolumes contributing to each average. Scale bars are 25 nm.
Figure 1—figure supplement 3. ResMap calculation of resolution for the whole-population CHO average.

Figure 1—figure supplement 3.

The CHO, whole-population average was generated using Relion. These data were broken into two independent groups for the gold-standard FSC in Figure 1—figure supplement 2. At the last iteration, two unfiltered and unmasked maps were generated. These unmasked and unfiltered maps were subsequently used for the ResMap resolution calculation. A difference map was generated from the two maps, instead of a soft mask. Searching between 2 and 4 nm with a 0.1 nm step, the mean resolution was 2.9 nm, but much of the triplet was at 2.4–2.8 nm.
Figure 1—figure supplement 4. CHO centrioles were flattened within the ice sheet.
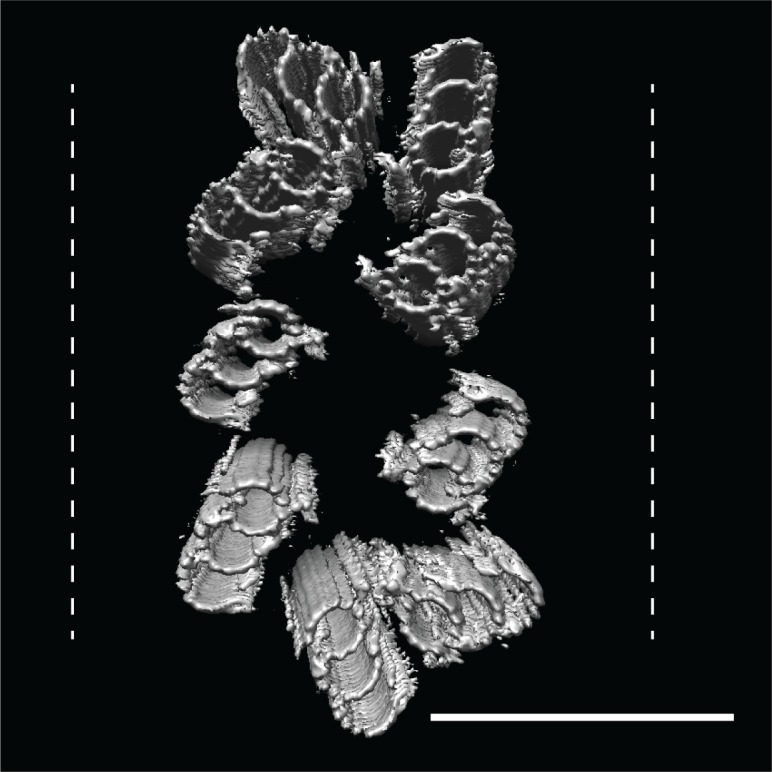
Figure 1—figure supplement 4.

A refit of the triplet average back into the raw data showed that all CHO centrioles that we imaged showed flattening orthogonal to the proximal-distal axis, with some centrioles resembling two parallel arrays of triplet microtubules. These refits suggested that while the A-C linkers are strong enough to hold the nine triplets together as a unit, they are also quite flexible. Dashed lines indicate ice-sheet thickness, typically 300 nm. Scale bar is 150 nm.