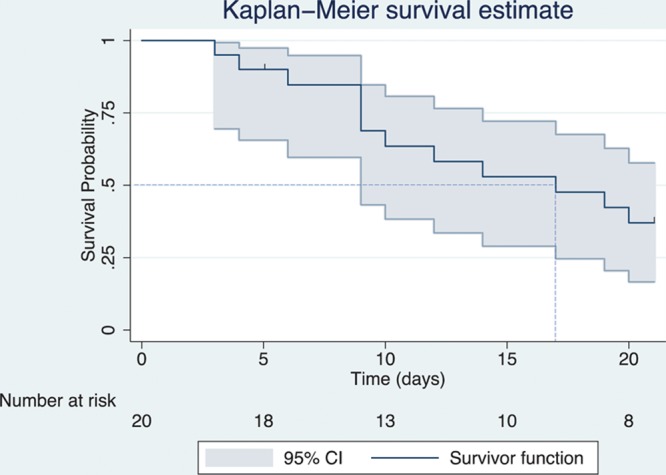
Figure 1.

Survival (survivor) function estimated by the Kaplan-Meier method, including 95% confidence bands. Censoring is indicated by vertical marks (at 5 and 21 d). The number of patients at risk at different time points is displayed on the graph. The point on the x-axis where the horizontal dashed line at a survival probability of .5 intersects the curve represents the estimated median survival time (17 d).
