Fig. 3.

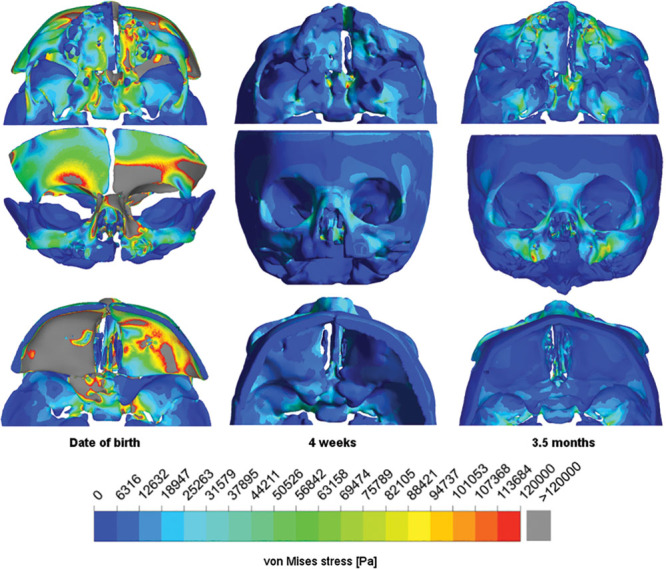
Von Mises stress distribution for the simulated skull in the caudal (upper row), coronar (middle row), and cranial (lower row) view of the newborn (left column), 4-week-old (middle column), and 3.5-month-old (right column) neonates.

Von Mises stress distribution for the simulated skull in the caudal (upper row), coronar (middle row), and cranial (lower row) view of the newborn (left column), 4-week-old (middle column), and 3.5-month-old (right column) neonates.