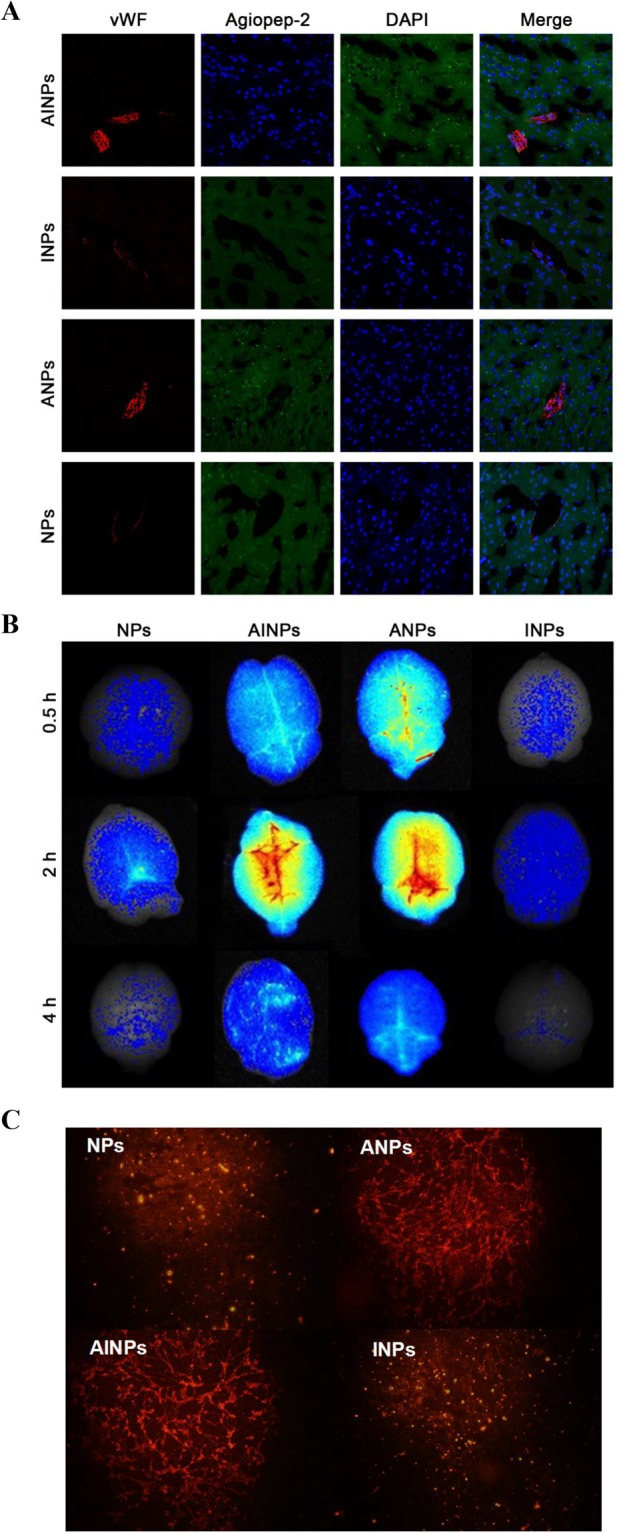
Figure 3.

Determination of distribution and intensity of NP, ANP, INP and AINP in the rat brain tissues by fluorescence imaging after treatment with NP, ANP, INP and AINP. (A) Fluorescence images, endothelial cells are stained in blue, the neuroglial cells are stained in red and green color represents the NPs; (B) ex vivo fluorescence imaging of brain separated from BALB/c nude mice 0.5 h, 2 h and 4 h after intravenous administration of NP, ANP, INP and AINP. (C) RhoB-Labeled NPs, ANPs, AINPs, and INPs ingested by BCECs.
