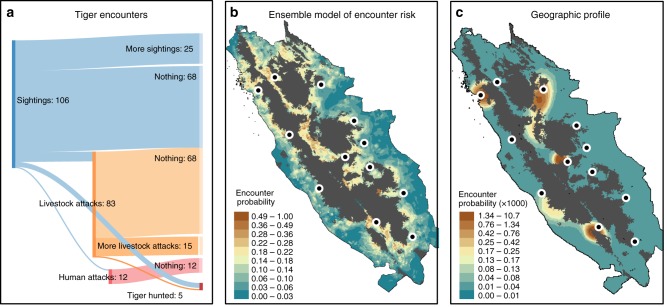
Fig. 1.
Tiger encounters over Kerinci Seblat between 2000 and 2013. a Sankey diagram of the progression of human–tiger encounters from sightings (blue), through to attacks on livestock (orange) and people (red), and tigers hunted. Encounters are linked if they occurred <6 months apart in the same village. The overall number of tigers hunted was 27, of which 5 were linked to previous encounters. b Risk of encounter predicted by an ensemble of binomial models, or c a geographic profile based on all 228 reported encounters 2000–2013. Locations of the study areas are shown by points. Probabilities across the entire geographic profile sum to 1

