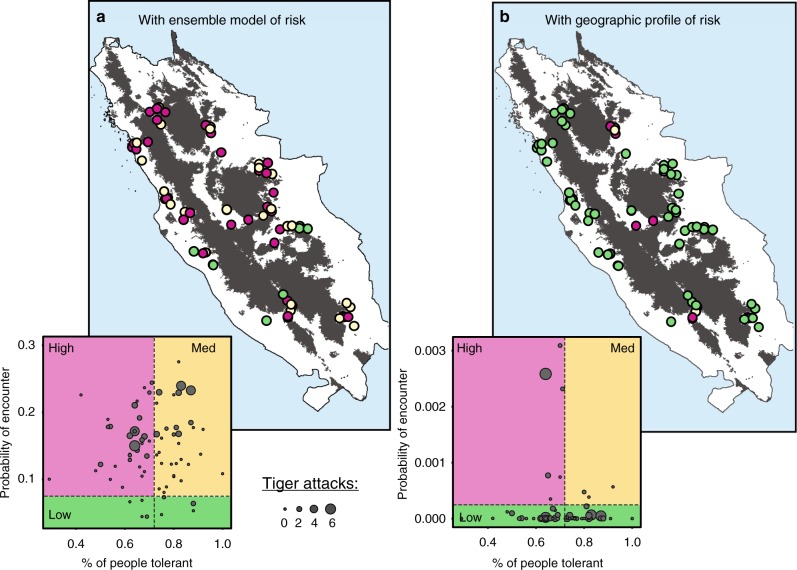
Fig. 3.
Prioritisation of villages for tiger conflict mitigation efforts using tolerance and risk data. The 75 survey villages are partitioned into high (magenta = above median risk; below median tolerance), medium (beige = above median risk; above median tolerance) and low (green = below median risk) priorities using a an ensemble of binomial risk models, or b a geographic profile. The estimates of encounter risk were based on models utilising all 228 human–tiger encounters; alternative estimates from models using sightings data only provided the same result. Point size is weighted by the number of attacks (on livestock or people) reported in each village

