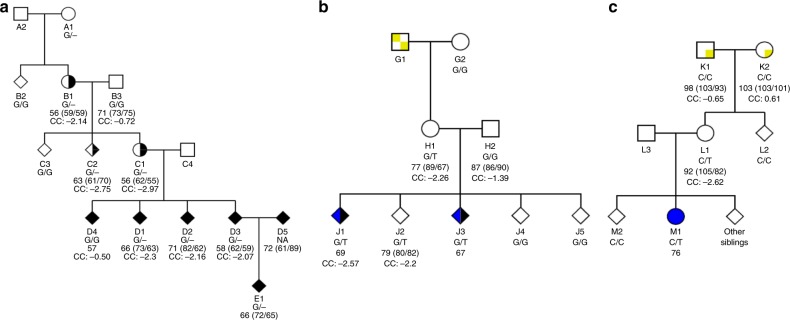
Fig. 1.
Pedigree plots for MAP1B LoF carrier families. a Family 1 (FAM1)—E712KfsTer10 (c.2133delG), b Family 2 (FAM2)—E1032Ter (c.3094 G > T) and c Family 3 (FAM3)—R1664Ter (c.4990 C > T). Squares are male, circles are female, diamonds are where gender is withheld, unfilled are unaffected, filled with black are intellectual disability affected, half black and white are individuals without a clinical diagnosis but an IQ below 70, blue are Autism spectrum disorder affected and yellow and white squares within the pedigree symbol indicates where it is most likely the initial MAP1B LoF mutation event occurred. Below each icon is the subjects: alias; MAP1B LoF variant genotype; Full-scale IQ (Verbal IQ/Performance IQ) from WASIIS or WPPSI-R (FAM1-B1,-B3,-C1,-C2,-D1,-D2,-D3; FAM2-H1,-H2,-J2; FAM3-K1,-K2,-L1 or FAM1-D5,-E1, respectively), or only Full-scale IQ reported from WISC-IV (FAM1-D4, FAM2-J1,-J3 and FAM3-M1), and corpus callosum (CC) volume (all individuals with structural MRI also have DTI except FAM1-C1). Refer to Supplementary Figure 2 for a description of how the de novo event carriers were identified

