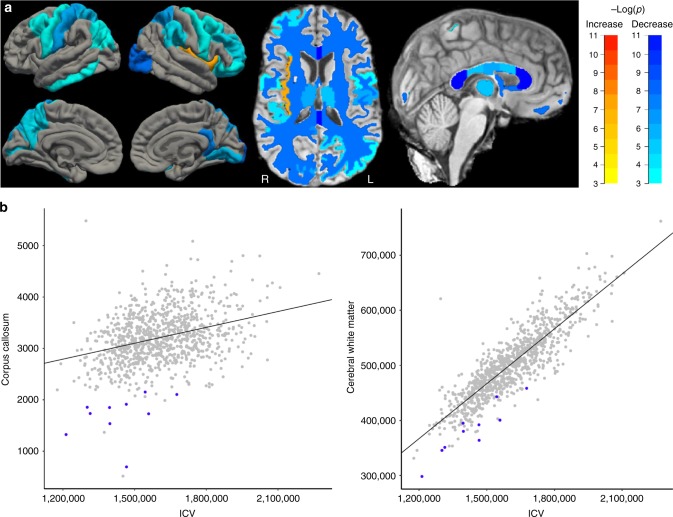
Fig. 2.
CC and WM volume differences in MAP1B LoF carriers compared with controls. a The colour scales refer to regions that are smaller (blue) or larger (red/yellow) in MAP1B LoF carriers (n = 10) compared with controls (n = 949). See Tables 3 and 4 for details. The four brain aspects in the left of the figure are from top left and clockwise: left hemisphere (LH) lateral surface, right hemisphere (RH) lateral surface, RH medial surface and LH medial surface. The middle image is an axial slice with the front of the brain at the top of the figure and demonstrates the ubiquitous nature of the WM and GM effects; R is right and L is left. The image on the right is a glass brain highlighting the significant reduction in WM in the corpus callosum. b Unadjusted corpus callosum and cerebral WM volumes plotted against intracranial volume (ICV) from FreeSurfer (in mm3) for MAP1B LoF carriers (blue) compared with controls (grey). Relative to the linear regression (diagonal line) the MAP1B LoF carriers have smaller CC and cerebral WM volumes than would be predicted from their ICV

