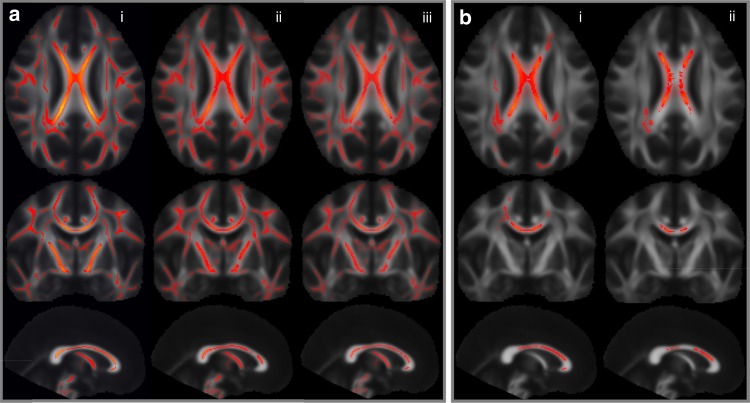
Fig. 3.
Diffusion (TBSS) data mapping from MAP1B LoF carriers compared with controls. Rows one, two, and three show, respectively, axial, coronal, and sagittal aspects of brain (MNI coordinates: 1, −13, 19) where heat map (red/yellow) intensity represents a significant change in fractional anisotropy (FA). a We compared MAP1B LoF carriers (n = 9) with three control groups (column i: normal range controls (n = 181), column ii: controls with small CC volume (β < −1.5 SD, n = 15), and column iii: controls with small WM volume (β < −1.5 SD, n = 10)) and found the carriers to have significantly lower brain-wide FA compared with all three control groups. b To determine whether a smaller CC volume generally leads to a decrease in FA, we compared the, column (i) 15 controls with smaller CC with 166 normal range controls and, column (ii) the ten controls with smaller WM with 160 normal range controls and found a reduction in FA only in the densest part of the CC. Family wise error (FWE) corrected significance threshold of 0.05

