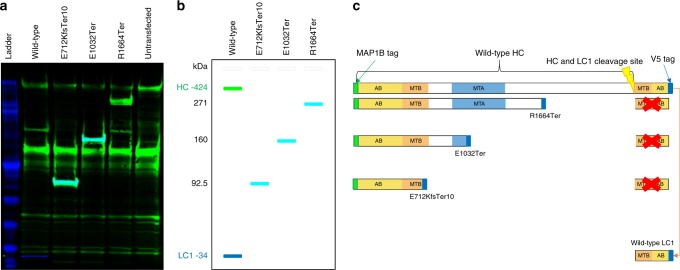
Fig. 4.
Western blot of antibody binding to wild-type and truncated MAP1B proteins. a An image, from the Odyssey system, where the colour coded infrared fluorescent signals from the 700 nm channel (V5 antibody signal—blue) and the 800 nm channel (MAP1B antibody signal—green) are taken from the same blot; cyan indicates where both antibody signals overlap. See Supplementary Figure 7 for the individual V5 and MAP1B antibody signal greyscale pictures. b A schematic diagram of what each band on the western blot represents in the context of protein size (heavy chain (HC), light chain 1 (LC1) and truncated proteins). c A schematic diagram of truncated MAP1B and an indication of whether the anti-V5 or anti-MAP1B antibodies bind the protein product. The wild-type HC is only recognised by the anti-MAP1B antibody (green), and the wild-type LC1 is only recognised by the anti-V5 antibody (blue), while both anti-MAP1B and anti-V5 antibodies bind to all three truncated protein products as they contain both the MAP1B (amino acids 6-31) and V5 tags (cyan bands in b). The red X indicates that the LC1 is not produced as a consequence of the MAP1B truncation. AB actin-binding domain, MTA microtubule assembly helping site, putative, MTB microtubule-binding domain

