Fig. 2.
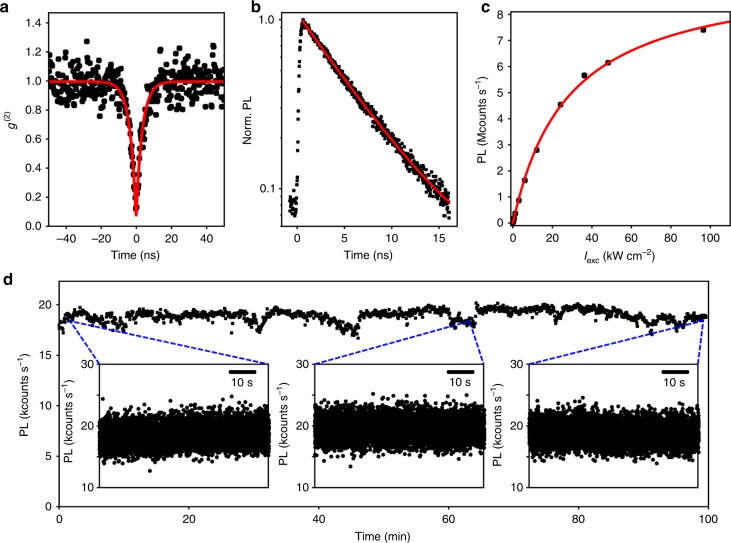
Photophysics of a single GQD. a Second-order correlation function g(2)(τ) recorded from a diffraction limited spot such as the one of Fig. 1 (black dots), showing a strong antibunching. A fit (red line) with a function yields g(2)(0) = 0.05 ± 0.05 and a characteristic time of τ1 ∼ 3.5 ns (FWHM of the IRF of the detector ∼0.9 ns). b Time-resolved PL of a single GQD (black dots) detected on the whole spectrum, fitted by a mono-exponential decay (red line) with a time constant τ = 5.37 ns. c Saturation curve of a single GQD (black dots) as a function of the pump power. A fit by Eq. (1) (red line) leads to a saturation power density of 28 kW cm−2 and a saturation intensity Isat ∼ 9.7 Mcounts/s. d PL time trace of a stable GQD over 100 min with a binning time of 200 ms. Fluctuations are due to setup instabilities. Zooms are shown on shorter timescale with a binning time of 10 ms

