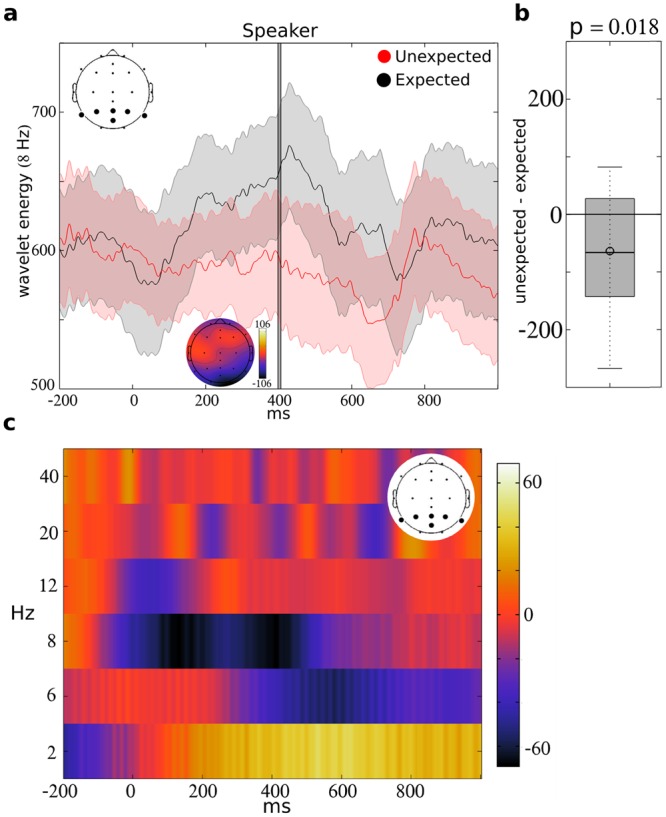
Figure 2.

Difference in the speaker’s spectral energy during “expected” and “unexpected” conditions. The wavelet energy within the alpha band (centered on 8 Hz) is indicated for the speaker in (a) following the “expected” (black) or “unexpected” (red) prompt. Responses were averaged across parietal electrodes P7, P3, Pz, PO2, P4, and P8, as indicated by the plot on the upper left. The gray bar at 402 ms indicates the peak calculated from the overall average, and the topographic plot indicates the difference (unexpected minus expected) in average alpha energy at that time point across electrodes. The adjacent boxplot (b) indicates the distribution of individual differences (unexpected minus expected) in wavelet energy at that point. These values significantly differed from zero (p = 0.018). The difference in the speaker’s average spectral energy during response preparation (“unexpected” minus “expected”) is indicated for 2, 6, 8, 12, 20 and 40 Hz (y-axis) in (c). The onset of the “expected” or “unexpected” prompt is indicated by 0 ms (x-axis). Responses are averaged across parietal electrodes P7, P3, Pz, P02, P4, and P8, as indicated by the plot on the upper right.
