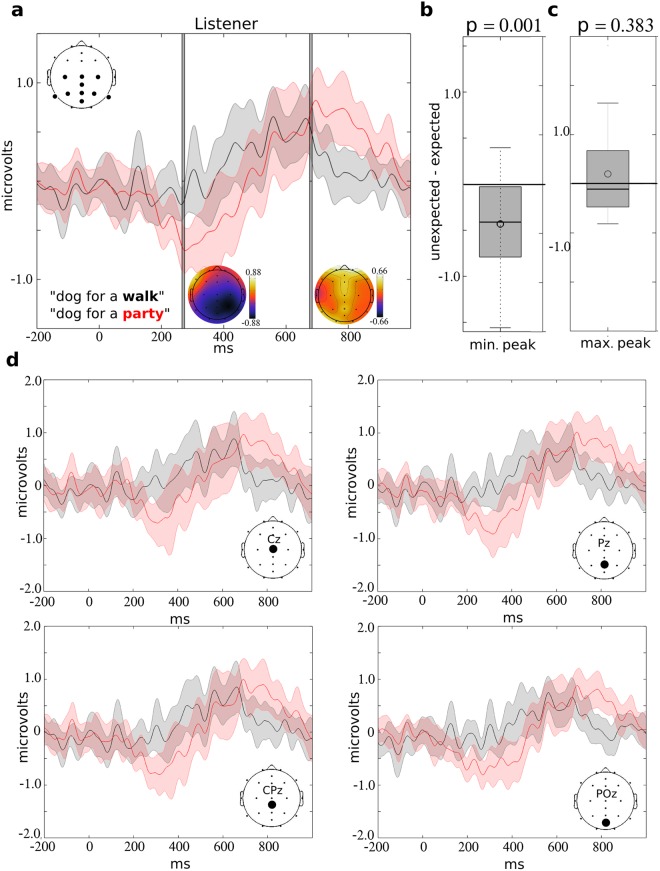
Figure 3.
Average listener ERP to expected and unexpected words. The ERP response within the listener is indicated in (a) following the onset of the unexpected (red) or expected (black) word. Responses were averaged across central-parietal electrodes P7, P3, Pz, PO2, P4, P8, CPz, C3, Cz, and C4, as indicated by the plot on the upper left. The gray bars at 270 and 680 ms indicate the minimum and maximum peaks identified from the overall average, and the adjacent topographic maps indicate the difference (unexpected minus expected) in average amplitudes across electrodes at each time point. The boxplots indicate the distribution of individual differences (unexpected minus expected) in ERP responses for the minimum (b) and maximum (c) peaks. These values significantly differed from zero for the negative peak (p = 0.001) but did not reach statistical significance for the positive peak (p = 0.383). The width of shading around the red and black lines represents the 95% confidence interval of the mean. Within (d) the average ERP is indicated for Cz, CPz, Pz, and P0z electrodes (see topographic plot) for the expected (in black) and unexpected (in red) conditions. The width of shading around the red and black lines represents the 95% confidence interval of the mean.

