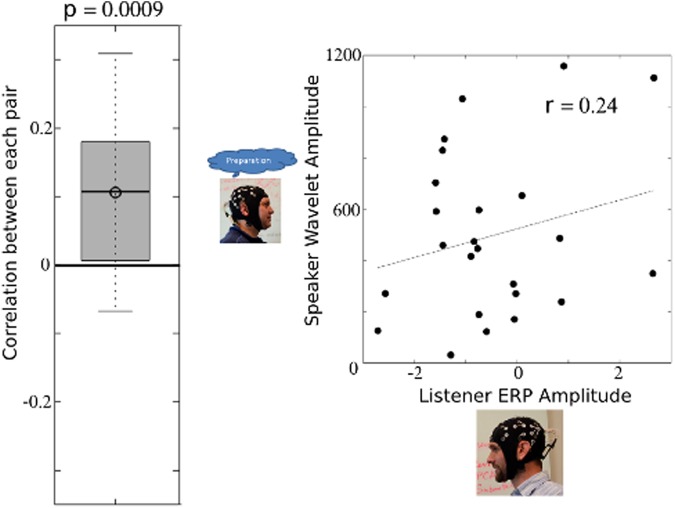
Figure 4.
Relationships between speaker alpha and the listener ERP. The speaker’s preparatory alpha band (centered on 8 Hz) amplitudes were correlated with the listener’s minimum ERP amplitudes. The distribution of correlations across subject pairs is indicated in the boxplot in (a). The Fisher z-transformed Pearson correlation coefficients significantly differed from zero (p = 0.0009). A representative scatterplot of single-trial lower alpha band amplitudes within the speaker (y-axis) and single-trial listener ERP amplitudes (x-axis) is indicated in (b). Reduced wavelet amplitudes within the speaker during preparation appear to correspond to a greater N400 amplitude within the listener (r = 0.24). The 95% confidence interval includes r = −0.24 to r = 0.62).

