Figure 1.
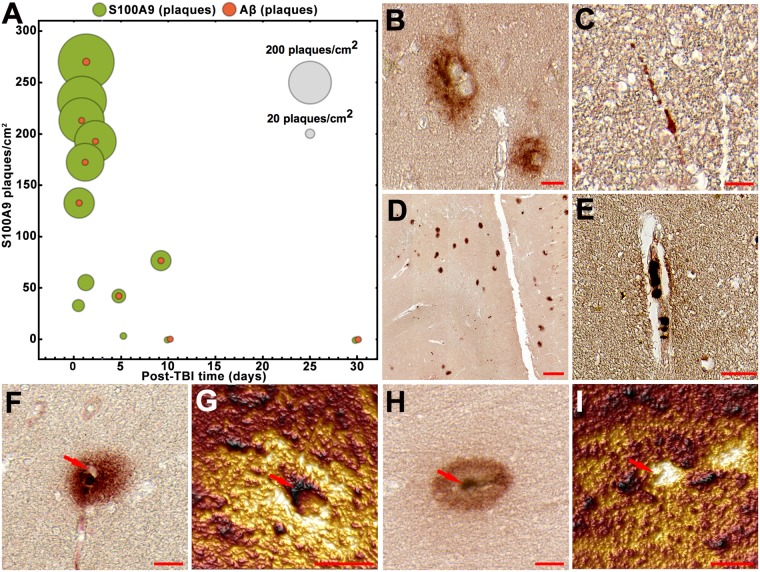
S100A9 and Aβ in TBI tissues. (A) Bubble chart showing counts of the precursor-plaques composed of Aβ (red) and S100A9 (light green), respectively, in the whole human TBI hippocampi and surrounding tissues in individual patients versus increasing post-TBI time (n = 13 TBI patients). Each bubble corresponds to the total counts in each individual patient tissue; the counts of S100A9 precursor-plaques per cm2 of tissue are plotted along y-axis and the scale bubbles are presented in grey. Representative images of Aβ immunopositive (B) precursor-plaques and (C) neuronal axons. Representative images of S100A9 immunopositive (D) precursor-plaques, (E) cells in blood vessel and (F,H) zoomed individual precursor-plaques. (G,I) AFM topographic images of S100A9 precursor-plaques shown in (F,H), respectively. Red arrows in (F–I) show the same position in optical and AFM images, respectively. Scale bars are 20 µm in (B,F and H), 50 µm in (C,E), 200 µm in (D) and 10 µm in (G and I). AFM z-heights correspond to a color gradient from 0 µm (dark brown) to 1.7 µm (yellow light).

