Figure 2.
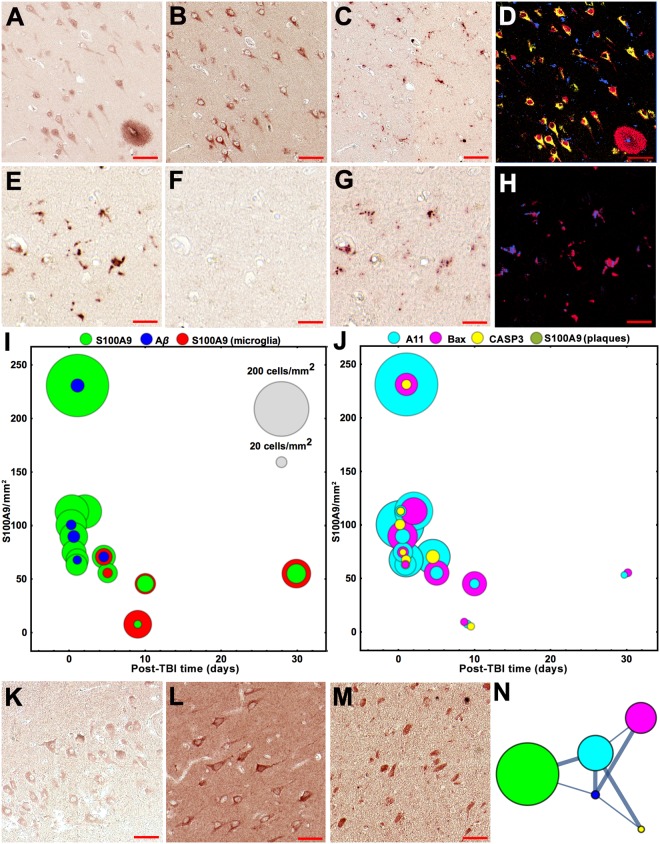
Analysis of intracellular S100A9/Aβ aggregation and apoptosis in TBI tissues. Representative images of sequential immunohistochemistry with (A) S100A9, (B) A11 and (C) CD68 antibodies (4 h post-TBI). (D) Superposition of the corresponding images in pseudo-colors, i.e. S100A9 staining is shown in red; CD68 – in blue and A11 – in yellow. Representative images of sequential immunohistochemistry of microglial cells with (E) S100A9, (F) A11 and (G) CD68 antibodies (5th post-TBI day). (H) Superposition of the corresponding images in pseudo-colors, i.e. S100A9 staining is shown in red and CD68 – in blue. (I,J) Bubble charts showing the counts of immunopositive cells in the whole TBI hippocampi and surrounding tissues of individual patients upon increasing post-TBI time, n = 13 TBI patients. Each bubble corresponds to the total counts in individual patient tissue; the counts of S100A9 immunopositive neurons per mm2 are plotted along y-axis and the scale bubbles are presented in grey in (I). The counts for microglial cells reactive with S100A9 antibodies are shown in red, for neurons reactive with antibodies to S100A9 – in green, to Aβ – in blue, amyloid oligomers – in cyan, Bax – in magenta and activated caspase-3 – in yellow. Representativie imagies of immunostaining of neurons with (K) Aβ, (L) Bax and (M) activated caspase-3 antibodies. (N) Graph network, showing connections between the S100A9, Aβ, A11, Bax and activated caspase-3 positive neurons. Nodes correspond to the types of immunopositive cells and their color coding is indicated in (I,J). Node sizes are proportional to cell amounts. Nodes are connected by edges, whose widths reflect the correlation strength; thick lines show strong correlation and thin lines – moderate correlation. Values of Spearman’s rho correlations between immunopositive cell and plaque counts are presented in Supplementary Table S3. Scale bars are 50 µm in (A–D and K–M) and 20 µm in (E–H).

